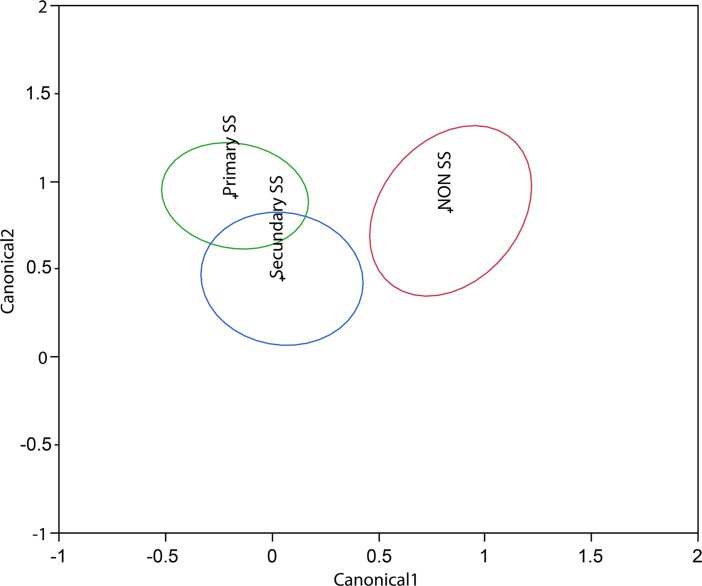
Fig 3. Discrimination map of the individuals with DED and Sjögren’s syndrome (SS).
Groups Primary SS (SS1), Secondary SS (SS2) and NSS and their similarities regarding the four tests used to evaluate DED. The center of each ellipse is marked by the abbreviation of each group studied (SS1 Group; SS2 group and NSS). The limits indicate the confidence interval of that group. X and Y axis numbers (Canonical 1 and 2, respectively) indicate the geometric distance of the discriminant analysis among the groups.

