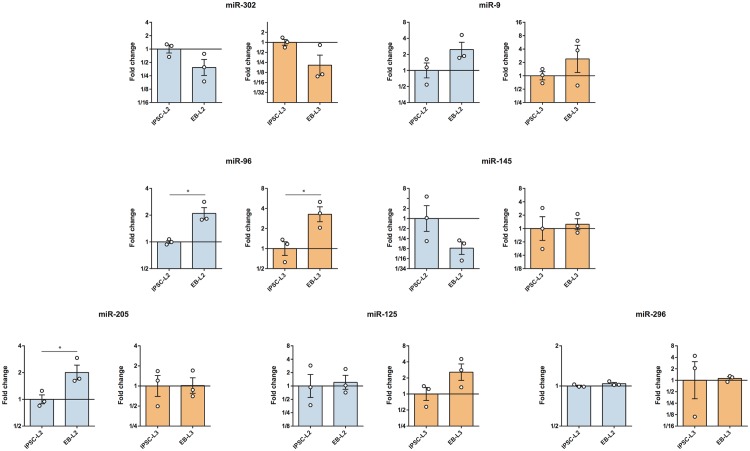
Fig 5. RT-qPCR analysis of 7 microRNAs in the iPSCs lines and the embryo bodies (EBs) derived from them, iPSC-L2 vs. EB-L2 and iPSC-L3 vs. EB-L3.
Results are presented as means ± SEM (n = 3). EB-L2 data were relativized to iPSC-L2 data and EB-L3 data were relativized to iPSC-L3 data. *Statistically different (p<0.05).

