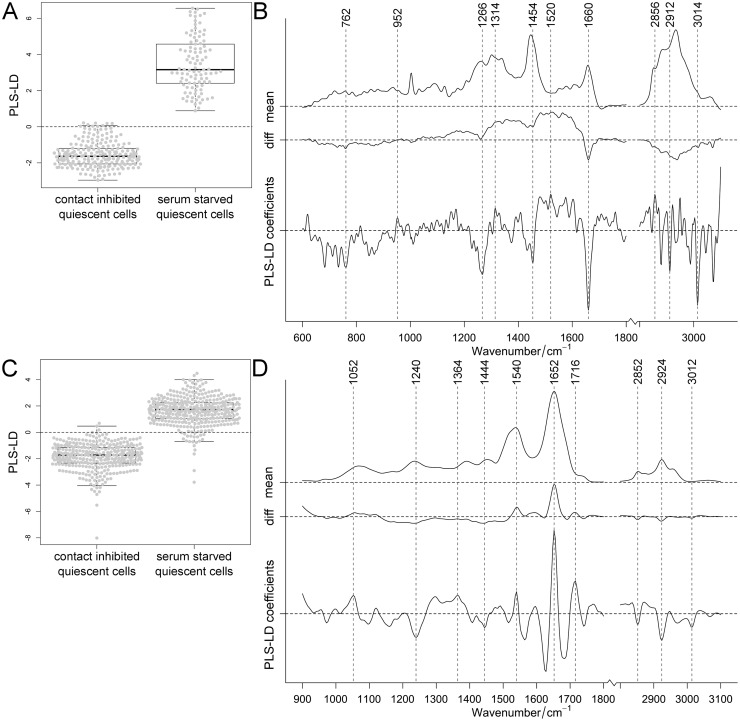
Fig 3. Classification of contact-inhibited and serum-starved quiescent cells.
PLS-LDA of Raman (A, B) and FT-IR spectra (C, D) of cells in which quiescence was induced either by contact inhibition or by serum starvation (data sets for 14 and 100 days induction combined). Distribution of cells shown in one-dimensional scatter plots combined with box-plots (A, C) showing 95% confidence interval with p-values <0.001 for Raman and FT-IR data. Mean and difference spectra (“diff”, serum starvation vs. contact inhibition) from the classified cells are plotted together with the PLS-LD coefficients vs. the wavenumber (B, D).

