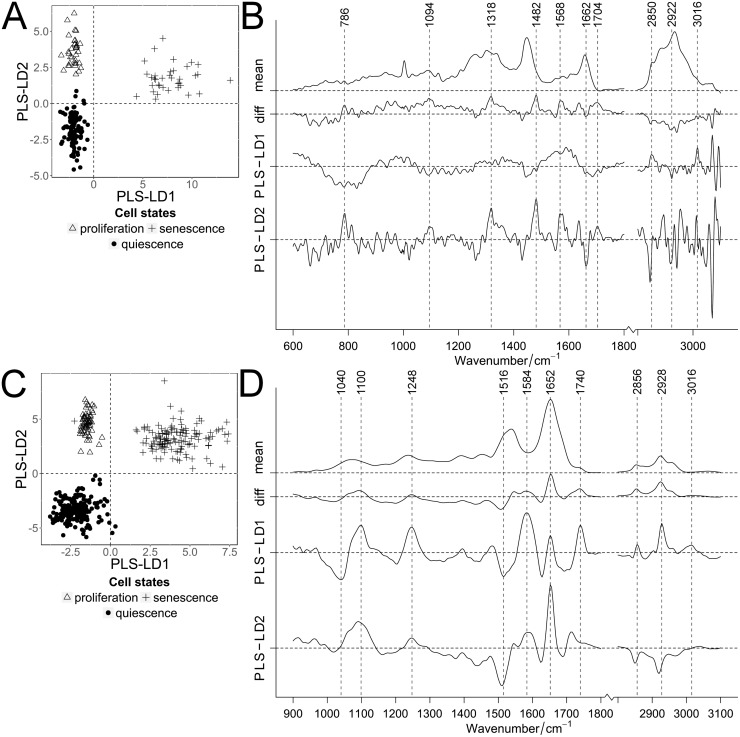
Fig 5. Classification of the 3 cell states: Proliferation, quiescence and senescence.
PLS-LDA of Raman (A, B) and FT-IR spectra (C, D) of proliferating, quiescent and senescent cells. Scatter plots (A, C) of cell states: proliferation (triangle), senescence (plus) and quiescence (black dots, 100 days long-term cultivation by contact inhibition). Mean and difference spectra (“diff”, (B) proliferation vs. quiescence and (D) senescence vs. quiescence) from the classified cells are plotted together with the PLS-LD1 and -LD2 coefficients vs. the wavenumber (B, D).

