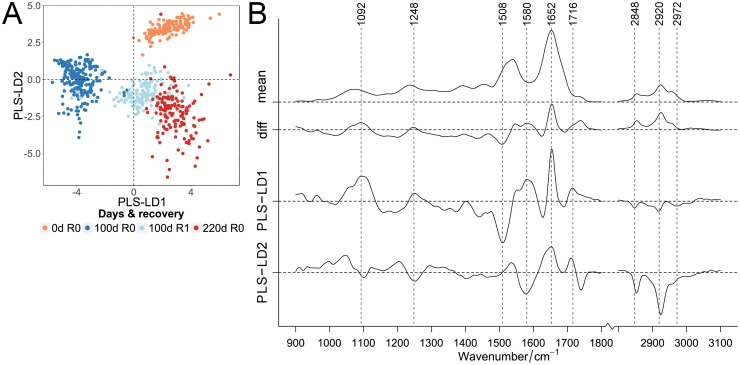
Fig 6. Classification of infrared spectra of proliferating, long-term cultivated quiescent and senescent cells.
PLS-LDA scatter plot of FT-IR spectra (A) of proliferating cells (“0d R0”) and 100 days contact-inhibited quiescent cells without recovery (“100d R0”) and recovered from quiescence (“100d R1”) compared to replicative-grown senescent cells (“220 d R0”). Cultivation time (0, 100 and 220 days) and proliferating cells recovered from quiescence (“R1”, pale blue) were specified by color (0 days: orange, 100 days: blue, 220 days: red). Mean and difference spectra (“diff”, 220 d senescence vs. 100 d quiescence “R0”) from the classified cells are plotted together with the PLS-LD1 and -LD2 coefficients vs. the wavenumber (B).

