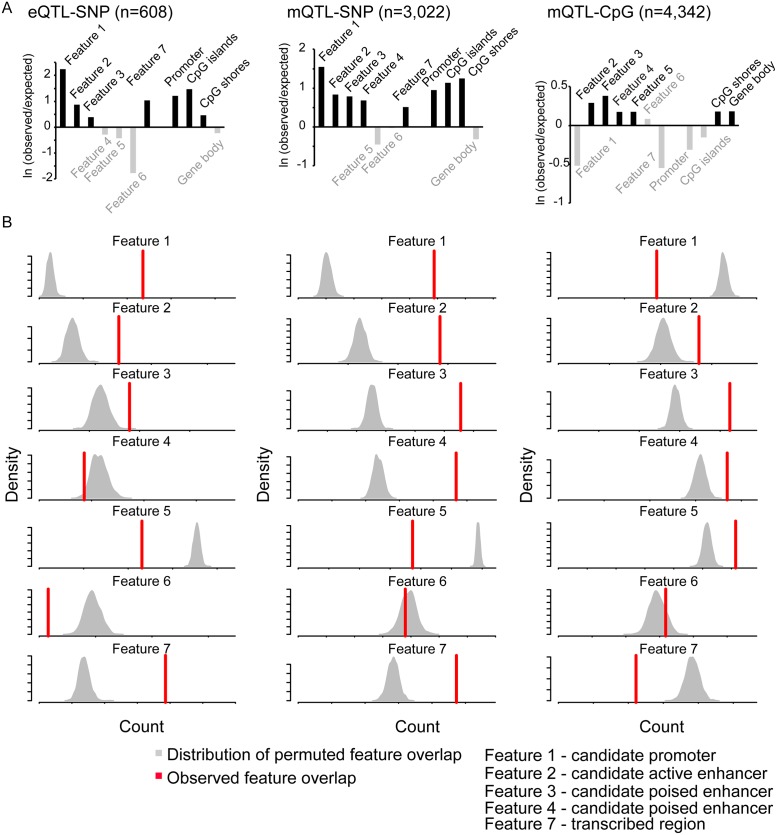
Fig 4. Genomic annotations of placental eQTLs and mQTLs.
Bar graphs representing the observed versus expected ratio for each feature define by ChromHMM analysis and from Refseq annotations. Grey filling represents enrichment that did not reach significance (A). Significance was assessed using a permutation test. The density plots represent the distribution of overlaps between random sampling and the different features whereas the red line illustrates the overlap value between candidate associations and the corresponding features (B). eQTL-SNP refers to enrichment considering the genetic variant associated to eQTL, mQTL-SNP refers to enrichment considering the genetic variant associated to the mQTL and mQTL-CpG refers to enrichment considering the CpG associated to the mQTL.

