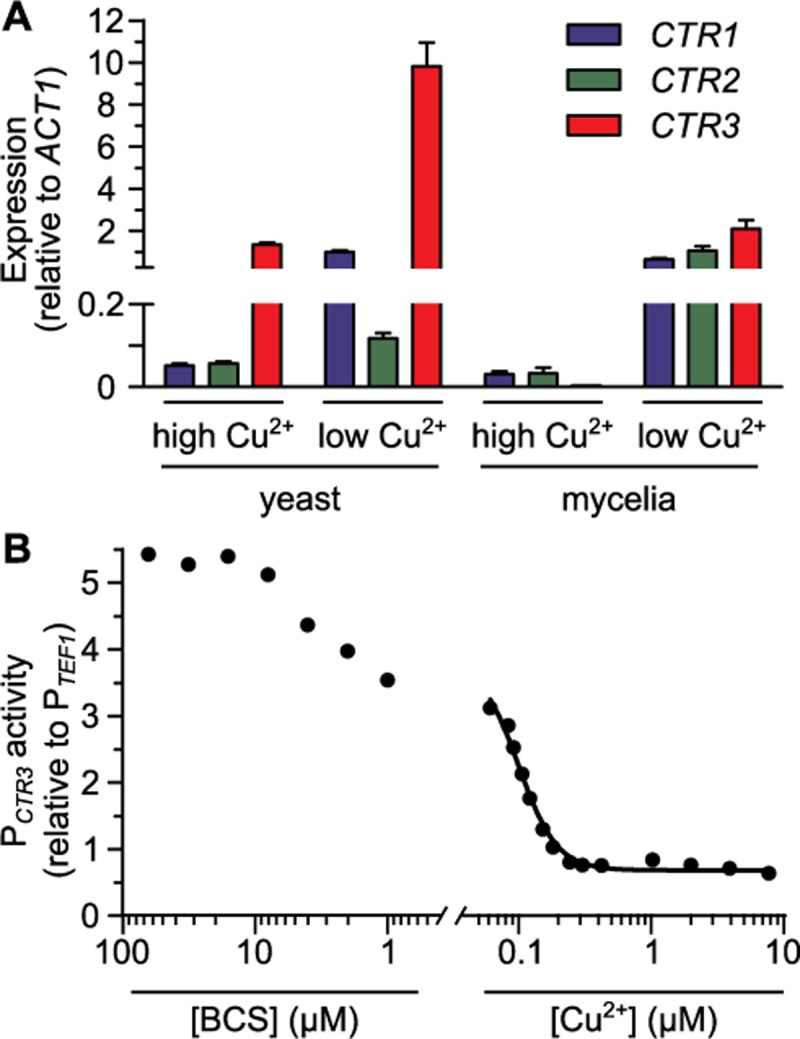
Fig 4. Copper limitation and differentiation into pathogenic yeast phase induce CTR3 expression.

Expression of CTR genes based on qRT-PCR (A) or a CTR3 promoter fusion to gfp (B). Expression was calculated relative to the constitutive expression of the TEF1 gene. (A) H. capsulatum cells in the host-infecting form (yeasts, 37°C) and environmental form (mycelia, 25°C) were grown in 3M media with low (10 nM) or high (10 μM) CuSO4 added and the CTR1 (blue), CTR2 (green), and CTR3 (red) transcript levels were quantified by qRT-PCR and calculated relative to ACT1 transcript levels. Data represent the average expression ± standard deviation of results from biological replicates (n = 3). (B) CTR3 promoter activity (PCTR3) of yeasts grown in 3M medium with different copper concentrations was measured by fluorescence and normalized to the fluorescence of a strain with a TEF1 promoter-gfp fusion (PTEF1). Fluorescence intensity was measured under different CuSO4 concentrations with concentrations lower than 60 nM (the trace amount present in 3M medium) achieved by addition of the copper chelator BCS. A non-linear regression standard curve (black line) was fit to the data with known copper concentrations. Data represent average CTR3 promoter activity of replicates (n = 3).
