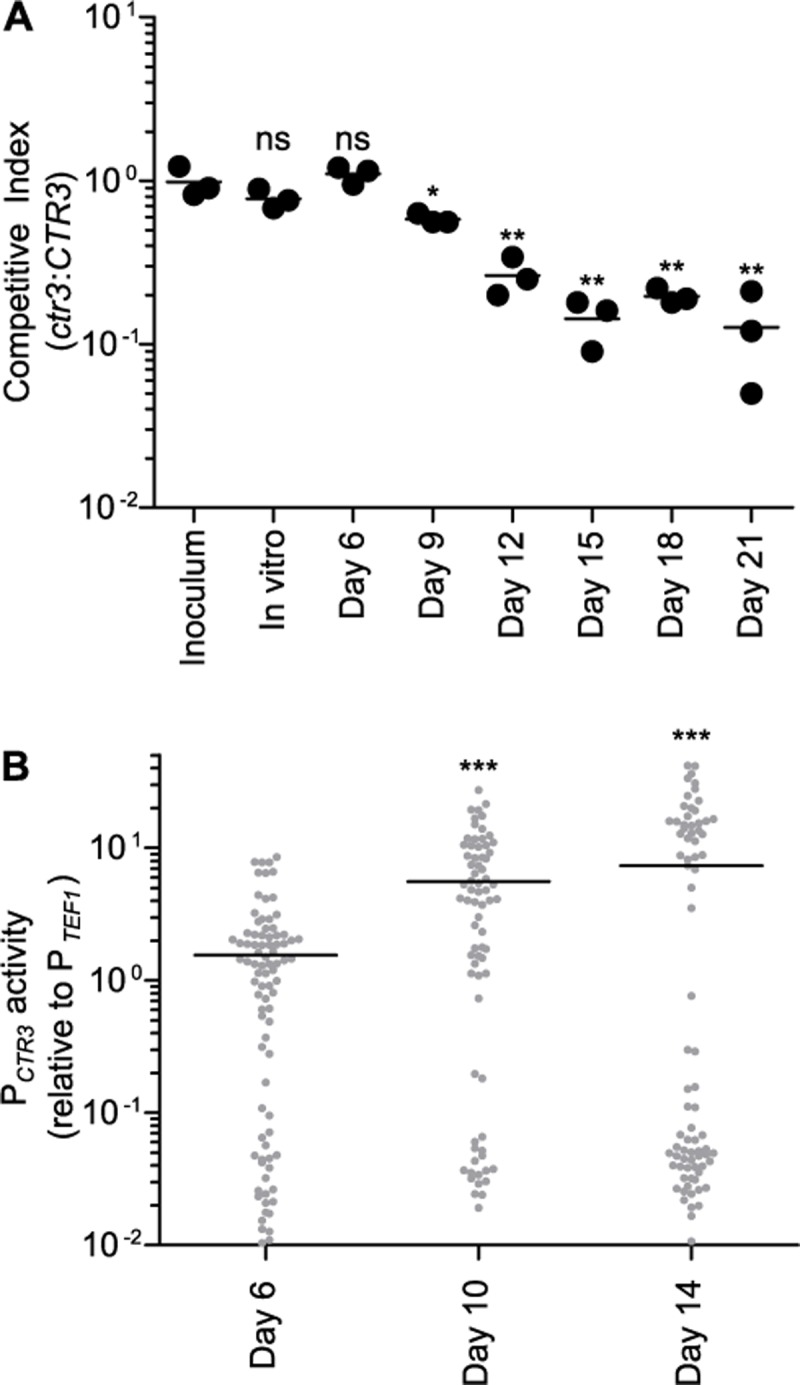
Fig 5. H. capsulatum virulence in vivo requires Ctr3 during the adaptive immune response.

Proliferation of H. capsulatum yeasts (A) and CTR3 promoter activity (B) in vivo following respiratory infection of mice. (A) The relative fitness (competitive index) of Ctr3-deficient (ctr3) compared to Ctr3-producing (CTR3) yeasts was determined by co-infecting mice intranasally with equal amounts of CTR3 (non fluorescent) and ctr3 (GFP-fluorescent) yeasts (1x10⁴ each). Fungal burdens were determined at 6, 9, 12, 15, 18, and 21 days post-infection by harvesting lungs, plating lung homogenates on solid medium, and enumerating fluorescent and non-fluorescent CFU. Data points represent the ratio of GFP-fluorescent to GFP-negative CFU at each time point (n = 3 mice) with the average ratio indicated (horizontal bar). Asterisks indicate significant (* P < 0.05, ** P < 0.01) differences compared to the ratio of the inoculum as determined by one-tailed Student’s t-test. (B) CTR3 promoter activity in vivo was determined by infecting mice intranasally with wild-type yeasts expressing either the CTR3 promoter-gfp fusion (PCTR3) or a TEF1 promoter-gfp fusion (PTEF1) and collecting lung tissue at 6, 10, and 14 days post infection. Lung cells were lysed to release intracellular yeasts and the fluorescence of yeasts quantified by microscopy. Fluorescence of individual yeasts with the CTR3 promoter-gfp fusion was normalized to the average fluorescence of yeast with the TEF1 promoter-gfp fusion. Data points represent the CTR3 promoter activity of individual yeasts and bars represent the average results from replicate infections (n = 3). For each infection, at least 60 yeasts were analyzed. Asterisks indicate significant (*** P < 0.001) differences compared to the CTR3 promoter activity at day 6 post-infection as determined by one-tailed Student’s t-test.
