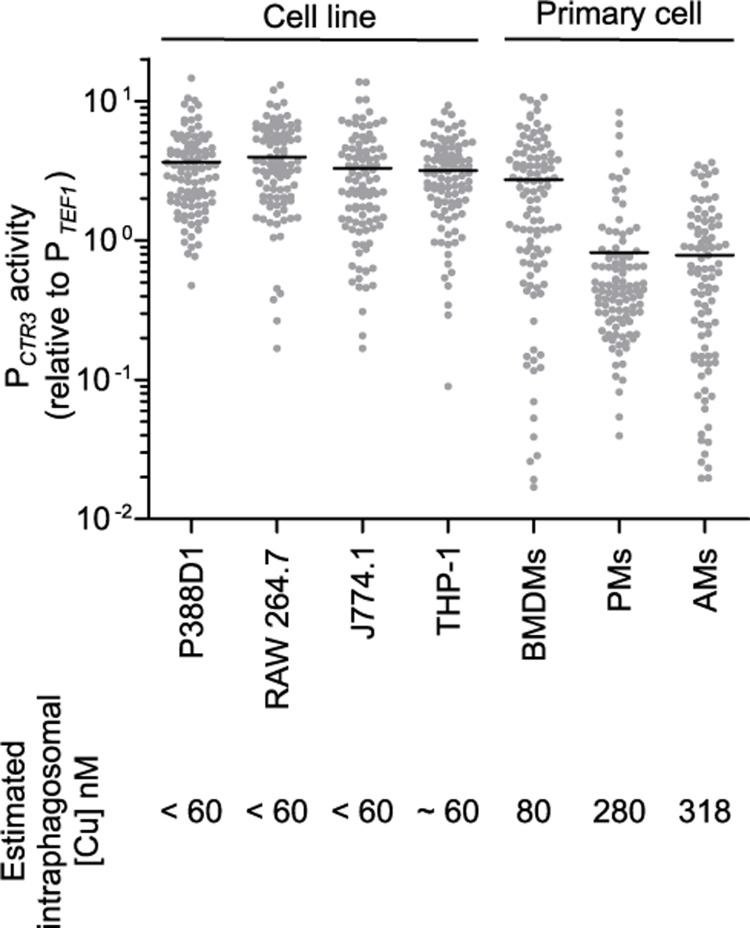
Fig 7. Phagosomal copper concentration differs among primary macrophages and macrophage cell lines.
Common macrophage cell lines (P388D1, RAW264.7, J774.1, and PMA-differentiated THP-1 cells) and unactivated primary cells (bone marrow derived macrophages (BMDMs), peritoneal macrophages (PMs), and alveolar macrophages (AMs)) were infected with H. capsulatum yeasts (MOI 1:2) with TEF1 or CTR3 promoter-gfp fusions for 48 hours. Macrophages were lysed, intracellular yeasts recovered, and the GFP fluorescence of individual yeast was quantified by microscopy (n > 100 yeasts for each sample). CTR3 promoter activity as indicated by the CTR3 promoter-gfp fusion was normalized to the average fluorescence of the TEF1 promoter-gfp fusion. Horizontal bars represent the average CTR3 promoter activity.

