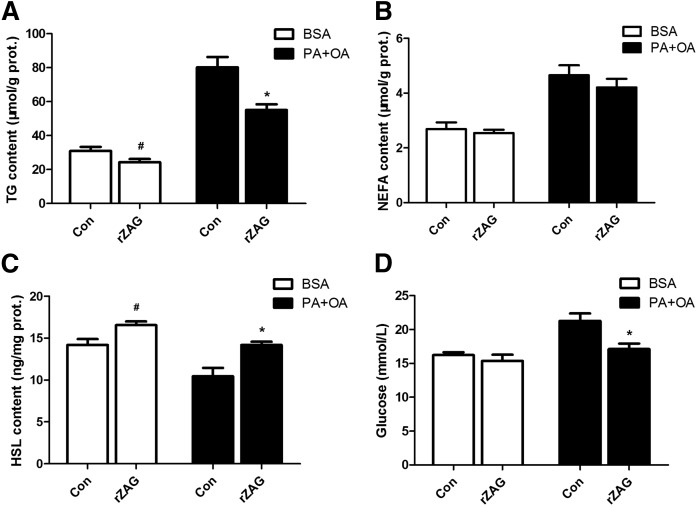
Fig. 5.
ZAG decreases intracellular lipid and promotes glucose uptake in C2C12 myotubes. Concentrations of intracellular TG (A), intracellular NEFA (B), intracellular HSL (C), and cell medium glucose (D). The cells of the BSA group were cultured with 18.3% BSA alone, and the cells of PA+OA (palmitate-oleate) group were cultured with 1.0 mM oleate-palmitate solution. Values are expressed as mean ± SEM. Hash (#) denotes a significant difference (P < 0.05) between the rZAG group and the control (Con) group in normal cells. Asterisk (*) denotes a significant difference (P < 0.05) between the rZAG group and the control group in lipid accumulation cells. Error bars indicate SEM.

