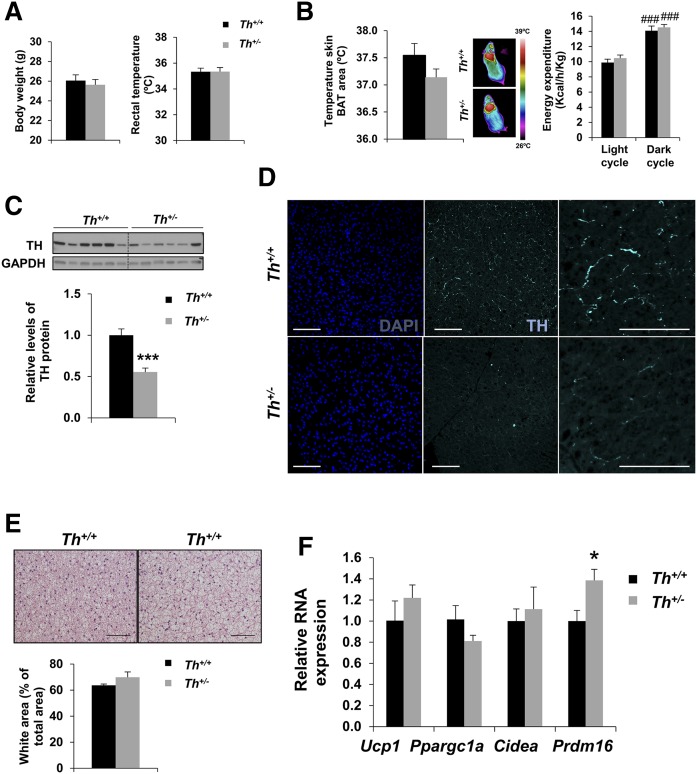
Fig. 1.
Characteristics of Th+/− mice in thermoneutrality. Body weight and rectal temperature (A), skin temperature surrounding BAT, and energy expenditure (B) were measured in Th+/+ and Th+/− mice housed 1 week at 29°C. C: Western blot analysis and quantification of lysates from BAT collected from Th+/+ and Th+/− adult mice showing TH levels using GAPDH as a loading control. D: Representative immunohistochemistry of TH at paraffin sections. Nuclei were stained with DAPI (blue) and TH+ fibers were detected by immunostaining (cyan). E: Representative sections of BAT from Th+/+and Th+/− mice stained with H&E and quantification of the percentage of white area versus total area. F: Quantitative RT-PCR of thermogenic gene expression in BAT. The graph represents the relative gene expression compared with Th+/+ mice. The data were normalized by Tbp RNA expression. Data are mean ± SEM. n = 5–10/group in A–C, n = 5–7/group in E, and n = 4–10/group in F. Mann-Whitney U test was used. *P < 0.05; ***P < 0.001 (between Th+/+ and Th+/− mice); ###P < 0.001 (between each genotypes in dark cycle versus light cycle). Scale bars: 75 μm.

