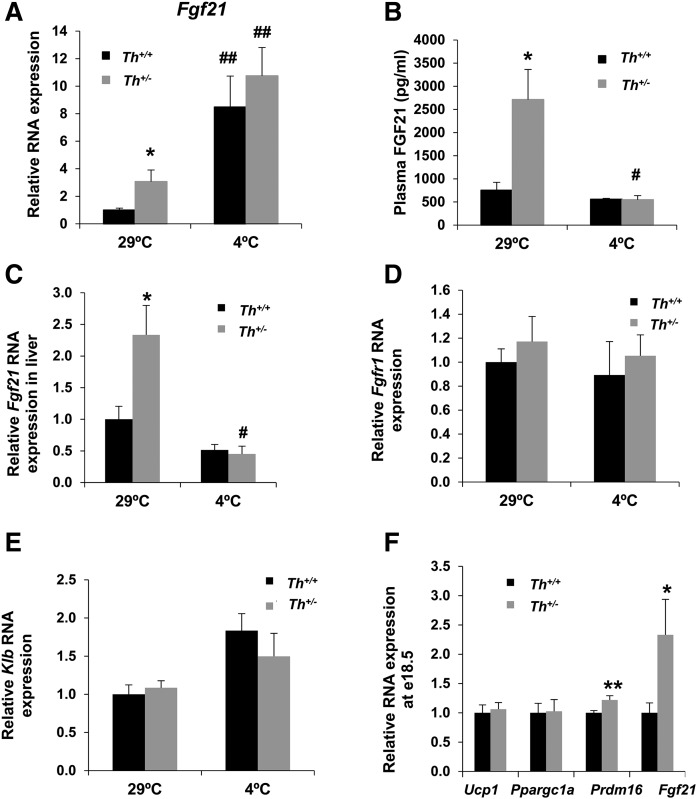
Fig. 4.
Th haploinsufficiency increased Fgf21 expression in BAT. A: Quantitative RT-PCR of Fgf21 RNA expression in BAT at 29°C and 4°C. B: Content of FGF21 protein in plasma in thermoneutral and cold conditions measured by ELISA. C: Relative expression of Fgf21 by quantitative RT-PCR analysis in livers at 29°C and 4°C. D, E: Relative expression of FGF21 coreceptors (Fgfr1 and Klb) by quantitative RT-PCR analysis in BAT at 29°C and 4°C. All data were relative to RNA levels of Th+/+ mice at 29°C. F: Quantitative RT-PCR of different browning markers RNA expression in BAT of e18.5 embryos. All data were relative to Th+/+ animals. Data are mean ± SEM. n = 9 or 10/group in A, n = 9/group in B, n = 10/group in C, n = 4 or 5/group in D and E, and n = 12–20/group in F. All expression data were normalized with Tbp RNA expression. Mann-Whitney U test was used. *P < 0.05; **P < 0.01 (between Th+/+ mice and Th+/− mice group); #P < 0.05; ##P < 0.01 (between each genotype at 4°C and 29°C).

