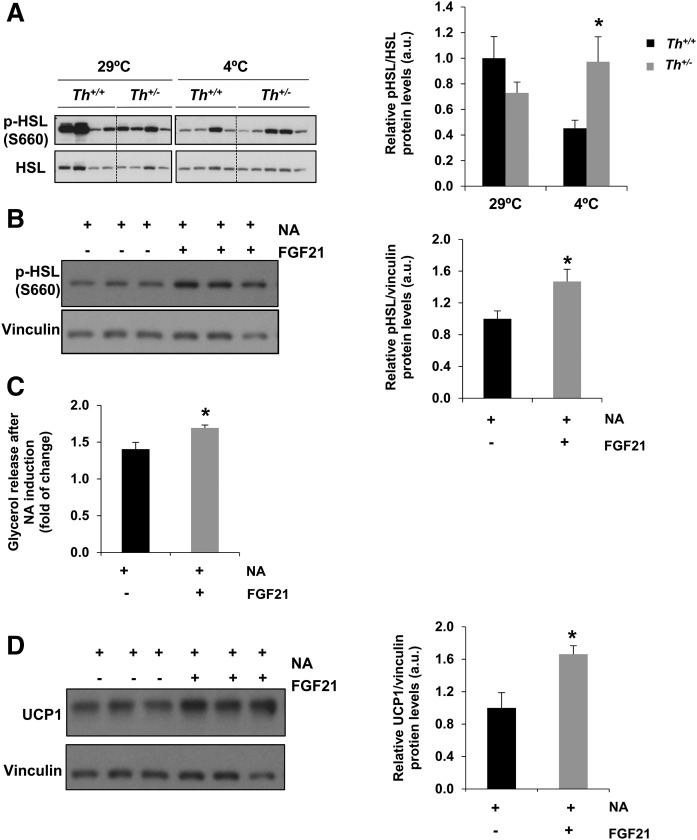
Fig. 6.
Evaluation of phosphorylation of HSL in BAT of Th+/+ and Th+/− mice and brown adipocytes stimulated with FGF21. A: Western blot analysis and quantification of phospho-HSL (S660) in BAT extracts. Total HSL was used as loading control. All data are relative to Th+/+ mice densitometry at 29°C. B: Western blot analysis and quantification of phospho-HSL (S660) in differentiated brown adipocytes with or without FGF21 pretreatment (1 µg/ml for 18 h) before the addition of 0.1 µM NA for 4 h. Vinculin was used as a loading control. C: Quantification of glycerol release after NA stimulation under conditions described in B. D: UCP-1 protein levels under conditions described in B. Two-way ANOVA was used in Western blot analysis in A, and Mann-Whitney U test was used in B–D. *P < 0.05 (between Th+/+ mice and Th+/− mice group or brown adipocytes pretreated or not with FGF21 and stimulated with NA between +FGF21 and –FGF21); *P < 0.05 (between each genotype). Data are mean ± SEM. n = 7–11/group in A, n = 5–7/group in B and D, and n = 3 independent experiments in C. a.u., arbitrary units.

