Fig. 7.
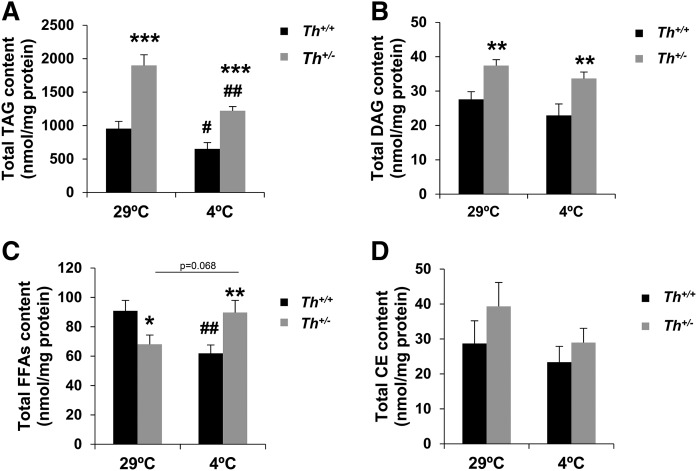
TH heterozygous mice had different content of TAG, DAG, and FFAs at thermoneutrality or after cold exposure. The graph represents total content of TAG (A), DAG (B), FFAs (C), and CE (D) analyzed by lipidomics in BAT at 29°C or 4°C. The data were expressed by nmol/mg protein. Data are mean ± SEM. n = 10 or 11/group. Mann-Whitney U test was used in lipidomic analysis. *P < 0.05; **P < 0.01 (between Th+/+ mice and Th+/− mice group); #P < 0.05; ##P < 0.01 (between each genotype at 4°C and 29°C).

