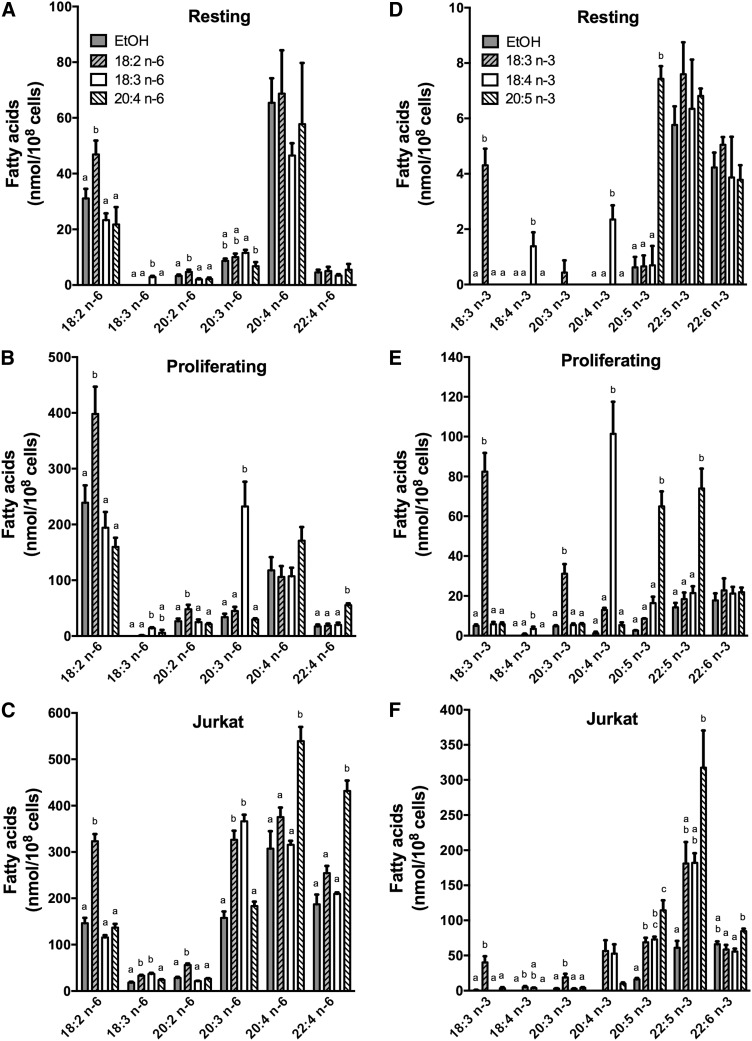
Fig. 2.
The mass content of n-6 and n-3 FAs in resting T-cells, proliferating T-cells, and Jurkat cells following supplementation with different PUFAs. Resting T-cells were incubated without stimulation, and proliferating T-cells were incubated with anti-CD3/anti-CD28 beads in the presence of 30 U/ml IL-2 for 3 days. T-cells and Jurkat cells were then incubated for 24 h with different PUFAs (18:2n-6, 18:3n-6, 20:4n-6, 18:3n-3, 18:4n-3, or 20:5 n-3) or ethanol as the control. Resting T-cells (A, D) were incubated with 15 µM of each FA, whereas proliferating T-cells (B, E) and Jurkat cells (C, F) were incubated with 5 µM of each PUFA. Cellular lipids were extracted, hydrolyzed, and transmethylated. Individual FAs were measured by GC-FID. The results are means ± SEMs of three (with n-3 PUFAs) or four (with n-6 PUFAs) independent experiments. Each independent experiment was conducted with cells obtained from a different subject. Cells were obtained from two males and two females. Values for each measured FA that do not have a common superscript are significantly different (P < 0.05) as determined by one-way ANOVA with repeated measures and Tukey’s post hoc test. EtOH, ethanol.

