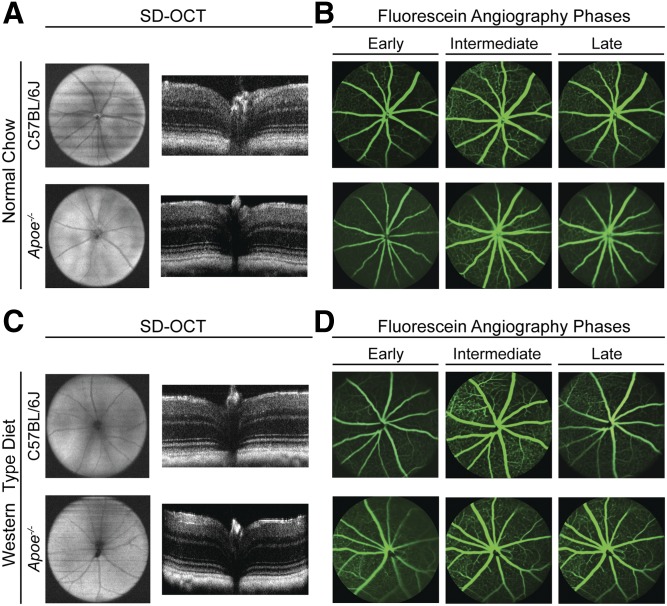
Fig. 1.
In vivo imaging of C57BL/6J (WT) and Apoe−/− mice on normal rodent chow and WTD. A, C: Ultra-high-resolution SD-OCT of mouse fundi (left) and retinal cross-sections (right). B, D: Fundus images of early (left), intermediate (center), and late (right) stages of fluorescein angiography. All images are representative (n = 3–5 mice per genotype).

