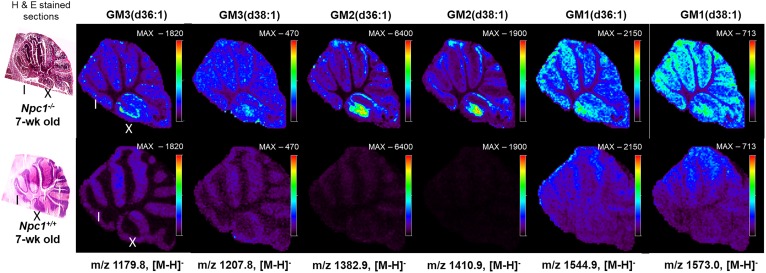
Fig. 1.
Representative MSI images of gangliosides in the cerebellum acquired from Npc1−/− (upper) and Npc1+/+ (lower) mice at 7 weeks of age with corresponding H&E-stained sections (left). Cerebellar lobules noted I and X. Raster distance between pixels is set at 50 μm. Scale bar indicates maximum intensity for each ion observed in both the control and mutant images. In all cases, the intensity of the ganglioside was higher in the mutant. The negative ion mass to charge for each ganglioside species is included.

