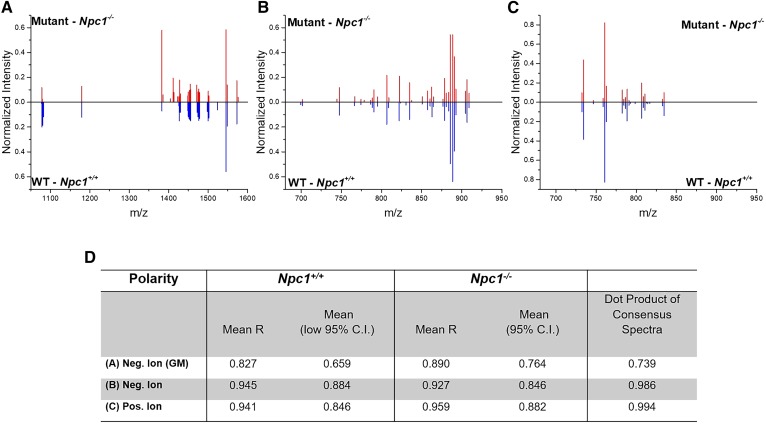
Fig. 5.
Consensus spectra and summary of MALDI-MSI replicate analysis in NPC1. Consensus mass spectra are provided for the GM mass region (A), negative ion (B), and positive ion (C), respectively. Data for WT is indicated in blue (below) and for the mutant in red (above). D: Data table shows average correlation coefficient between replicates for each dataset and the mean value of the 95% CI. The dot product analysis of the consensus spectra is also provided between the control and disease datasets (far right column). Dot products >0.9 are indicative of high similarity and, therefore, do not suggest spectral differences between control and mutant datasets.

