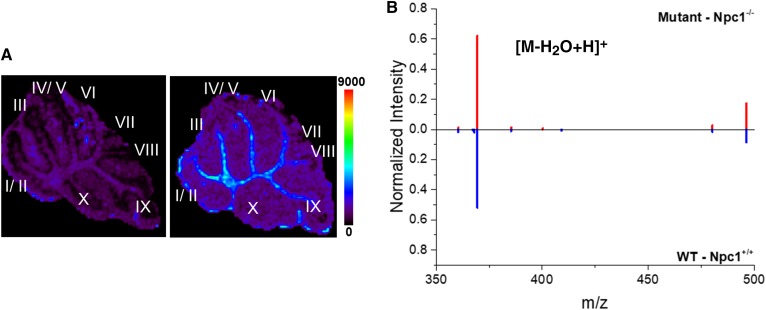
Fig. 6.
MALDI-MSI analysis of cholesterol. A: Representative MSI images of cholesterol m/z 369.3 (dehydrated ion, [M-H2O+H]+) in the cerebellum collected from Npc1−/− (left) and Npc1+/+ (right) mice at 7 weeks of age. Spatially, MSI images reveal an overall similar distribution between the genotypes however cholesterol may be slightly higher in the white matter of control animals. Scale bar represents 0–9,000 counts. B: Consensus spectra alignment following normalization of the top most intense 20 ions is provided for the cholesterol mass range for the whole cerebellum. The consensus spectra reveals similar normalized abundance of cholesterol for mutant (top, red) and WT (bottom, blue) tissue. Three animals of each genotype were analyzed, which included n = 8 and 7 technical replicates for mutant and WT, respectively.

