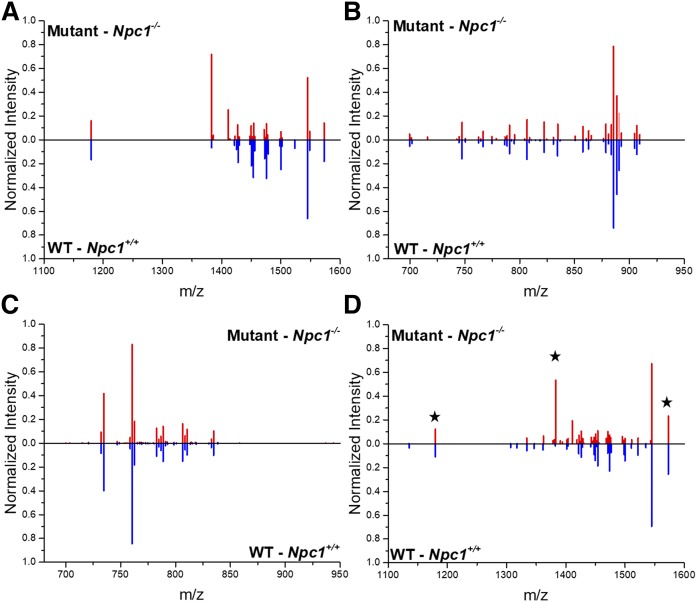
Fig. 7.
Lobule analysis in NPC1. Consensus spectra alignment following normalization of the top most intense 60 ions is provided for the GM mass range (A), negative ion mode (B), and positive ion mode (C) with a focus on lobule X, which does not show Purkinje cell loss in NPC1 disease. Significant spectral intensity differences are observed in the ganglioside region. D: Consensus spectrum obtained from evaluating the ganglioside mass range for lobules IV/V in control and Npc1 mutant cerebella. Example gangliosides presented in Fig. 1 are denoted with stars including m/z 1,179.8; 1,382.9; and 1,573.0 representing variants of GM3, GM2, and GM1, respectively. Similar to whole cerebellar analysis, these sphingolipids are altered in Npc1 mutant lobule IV/V compared with control.

