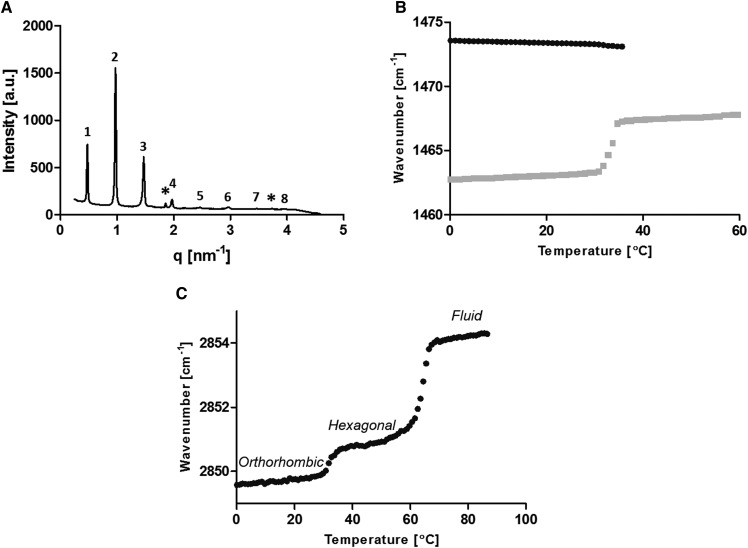
Fig. 3.
LPP-CH2 analysis. A: SAXD curve at 25°C. Both the LPP (numbered) at q values of 0.49, 0.97, 1.47, 1.97, 2.47, 2.97, 3.47, and 3.96 and CHOL single-crystal peaks (*) at q values of 1.86 and 3.74 nm−1 are detected in the sample. B, C: Thermotropic analysis of the δ and ν vibrational energy from FTIR analysis, respectively, highlighting the lateral phase transition temperatures by the loss of the peak split or an increase in the peak’s wavenumber.

