Fig. 6.
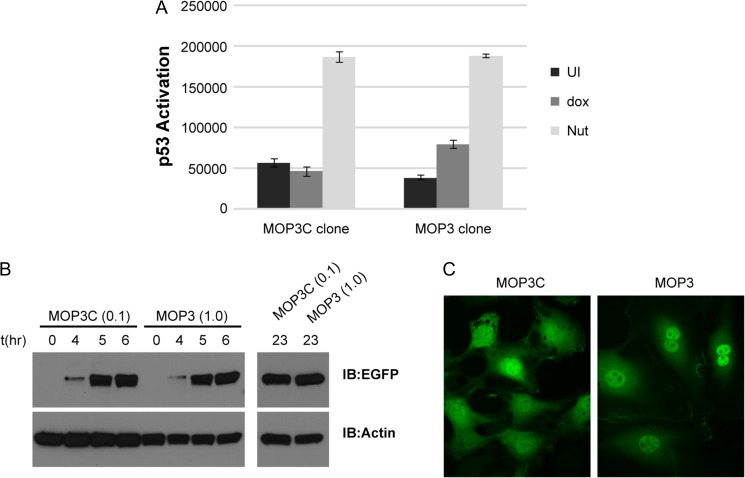
Characterization of T22 cell expressing EGFP-MOP3C or EGFP-MOP3. (A) T22 reporter activity of stable clones expressing either EGFP-MOP3C or EGFP-MOP3 after 48 h doxycycline (dox) induction. UI denotes uninduced samples. Nut denotes Nutlin induced samples. Data represents mean ± SD (n = 3). (B) Western blot analysis of protein levels after the indicated time of induction with dox. Concentrations of dox used for the respective EGFP-MOP3C or EGFP-MOP3 clones in μg/mL were indicated in parentheses ‘()’. (C) Live cell imaging of T22 clones after 5 h induction with dox using spinning disk confocal fluorescence microscope. Four z-stacks were taken. Each panel is a projection of sum slices of the z-stacks (ImageJ).

