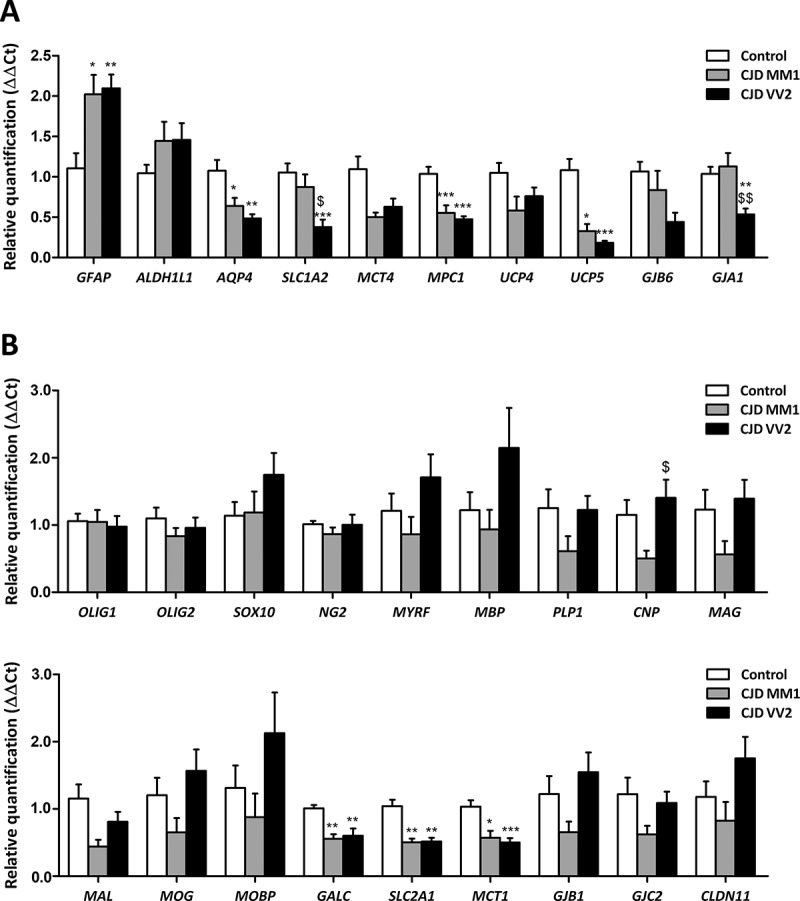
Figure 1.

Expression levels, as revealed by RT-qPCR, of genes coding for specific proteins of astrocytes (a) and oligodendrocytes (b) in frontal cortex area 8 of CJD MM1 and CJD VV2 compared with expression levels in controls. Statistical analysis of the expression data between groups uses one-way analysis of variance (ANOVA) followed by Tukey post-test for GFAP, AQP4, SLC1A2, MPC1, UCP4, GJB6, GJA1, OLIG1, OLIG2, NG2, CNP, MAL, GALC, MCT1, GJB1 and GJC2. Kruskal-Wallis test followed by Dunns post-hoc test was used for ALDH1L1, MCT4, UCP5, SOX10, MYRF, MBP, PLP1, MAG, MOG, MOBP, SLC2A1 and CLDN11 (SPSS software. IBM SPSS Statistics for Windows, Version 21.0). All data are expressed as mean ± SEM. Differences between groups are considered statistically significant at * P < 0.05, ** P < 0.01, *** P < 0.001 when comparing CJD cases with controls; and set at $ P < 0.05 and $$ P < 0.01 when comparing CJD MM1 with CJD VV2.
