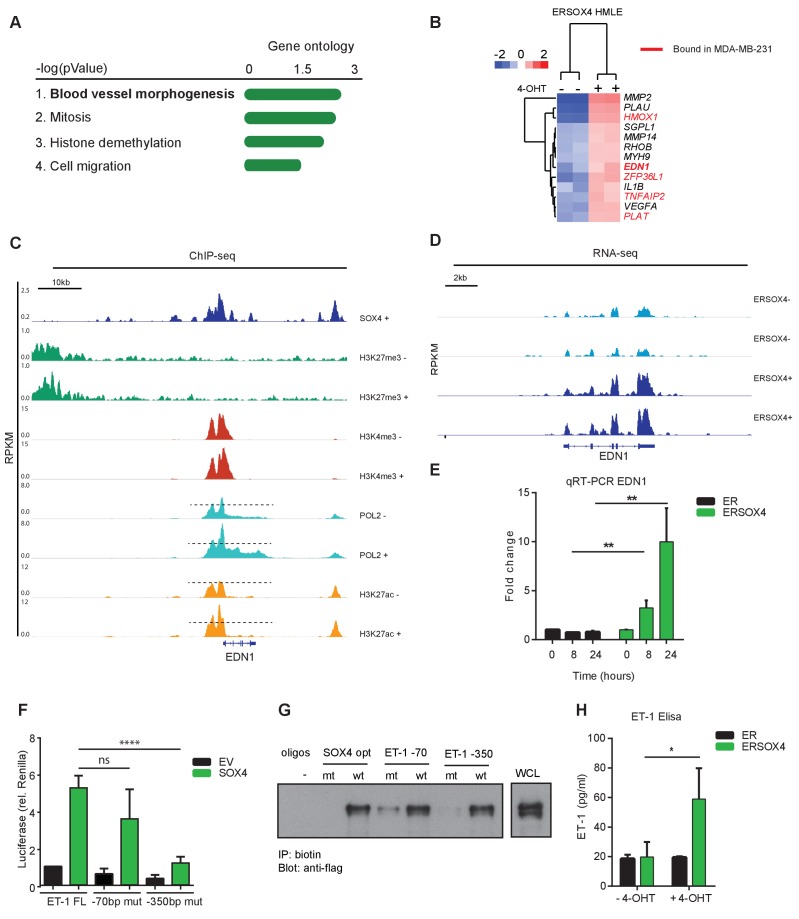
Figure 3. SOX4 directly regulates EDN1 mRNA expression and promotes production of the mature ET-1 peptide.
(A) Gene Ontology (GO) analysis on core-SOX4 target genes. Top terms are shown. (B) Heatmap of gene expression changes upon conditional SOX4 activation in HMLE cells for genes associated with the GO-term Blood vessel morphogenesis (HMLE regulated and bound). Genes with a SOX4-binding site within 20 kb of a TSS in MDA-MB-231 cells are annotated in red (C) Normalized ChIP-seq tracks for SOX4, H3K27me3, H3K4me3, POL2, and H3K27ac surrounding the EDN1 locus in HMLE-S4 cells. For histone marks and POL2 both DOX-treated and -untreated profiles are represented (-/+). (D) Normalized RNA-seq profile for the EDN1 gene in untreated and 4-OHT-treated ERSOX4 HMLE cells (-/+). (E) qRT-PCR analysis of EDN1 expression in 4-OHT-treated ER and ERSOX4 HMLE cells. Data represented as mean ± SD, normalized to β2M of three independent biological replicates (**p-value<0.01, Student’s t-test). (F) Luciferase assay in HEK293T cells transiently transfected with the full-length EDN-1 promoter (FL) as well as luciferase constructs in which the conserved sites have been mutated (−70 and −350). Results obtained from three independent biological replicates wherein three independent technical replicates were used per condition (ns: non-significant; ****p-value<0.001, Student’s t-test). (G) Pulldown assay in Flag-Sox4 transfected HEK293T cells using biotinylated DNA-probes. Probes matching an optimal SOX4-binding sequence, and the −70 bp and −350 bp of the EDN1 promotor sequence are indicated and mutated versions thereof (- indicates empty beads). Representative data obtained from three independent biological replicates. (H) Enzyme-linked immunosorbent assay (ELISA) analysis of ET-1 expression in the overnight conditioned media of 4-OHT treated and untreated HMLE-S4 cells. Results obtained from three independent biological replicates (*p-value<0.05, Student’s t-test).


