
Figure 2.
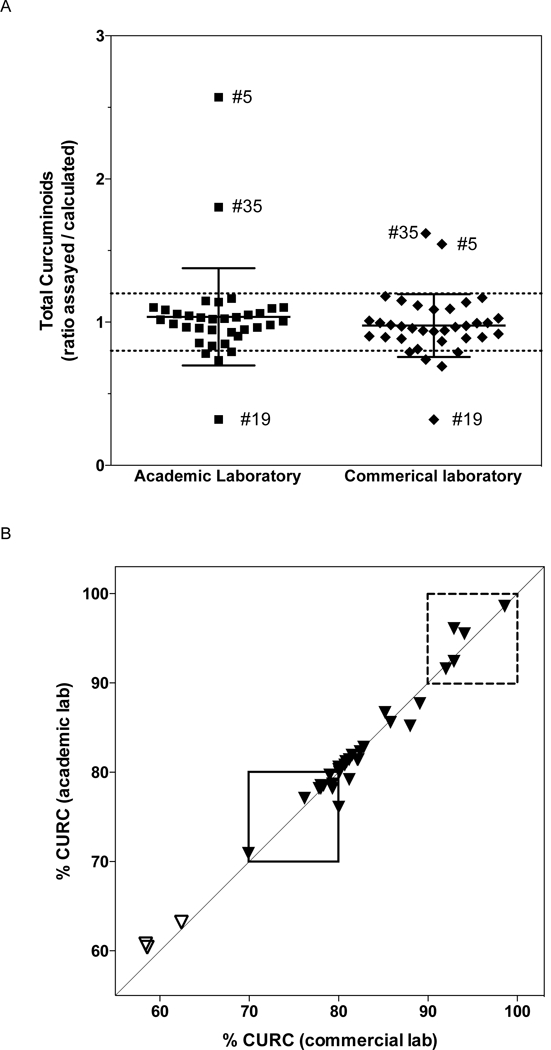
Assayed turmeric DS curcuminoid content (n= 35). (A) Total curcuminoid content (g/capsule), as determined by the commercial or academic laboratories, is expressed as a ratio of measured vs. calculated content (based on label information). Scatterplot includes mean ± SD, with dashed lines indicating ratios 20% different than anticipated. Means are not statistically different (p = 0.08). For products with outlying values, sample identification numbers are indicated. (B) Composition of curcuminoids, expressed as % curcumin [CURC], as determined by commercial vs. academic laboratories. Dashed box indicates products with >90% CURC, as assayed by both laboratories. Closed box indicates products meeting USP curcuminoid extract specifications (70–80% CURC), as assayed by both laboratories. Open triangles indicate root-only products, which do not contain curcuminoid extracts.