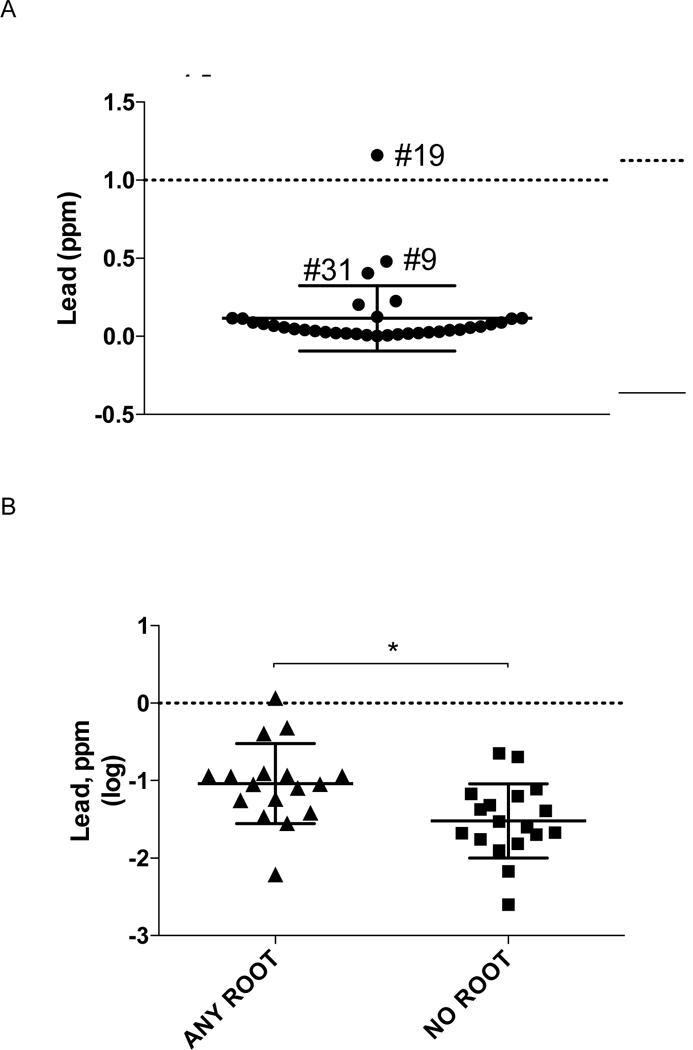
Figure 4.

Turmeric DS lead content (n= 35). (A) Lead content, expressed as ppm, is indicated for products, including mean ± SD. For products with outlying values, sample identification numbers are indicated. Dashed line indicates USP specified limit for lead content (1 ppm). (B) Lead content, log transformed to normalize distribution, for products containing root vs no root. Scatter plots indicate individual product and mean (± SD) values. * P < 0.007, root vs no root. Dashed line indicates USP specified limit for lead content.
