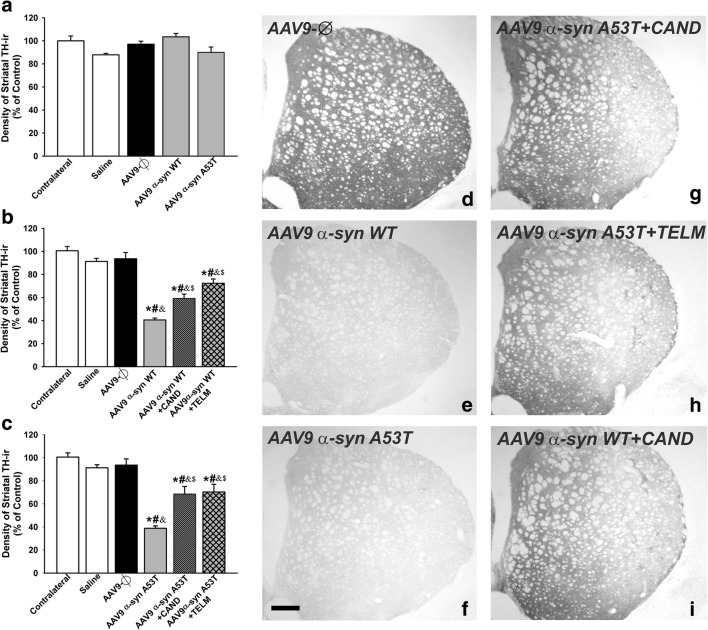
Fig. 5.
Optical densitometry of TH-ir striatal dopaminergic terminals of the noninjected side (contralateral, control) and 1 week (a) or 4 weeks (b–i) after injection of saline, or empty AAV9 vectors (AAV9-Ф), or AAV9 expressing human WT α-syn, or AAV9 expressing human A53T mutated α-syn in rats not treated or treated with the AT1 antagonists candesartan (CAND) or telmisartan (TELM). Representative photomicrographs of the striatal TH immunoreactivity of different groups of rats are shown in (d)–(i). The optical densitometry of striatal TH-ir of the different experimental groups is shown in (a)–(c). Data are means ± SEM. *p < 0.05 relative to the noninjected side (contralateral, control), #p < 0.05 relative to the group treated with saline, &p < 0.05 relative to the AAV9-Ф-injected group, $p < 0.05 relative to the group injected with AAV9 expressing human WT α-syn (b) or expressing human A53T mutated α-syn (c). One-way ANOVA and Holm–Sidak post hoc test. Scale bar = 500 μm. Abbreviations: ANOVA = analysis of variance; SEM = standard error of the mean; Ф = empty-null

