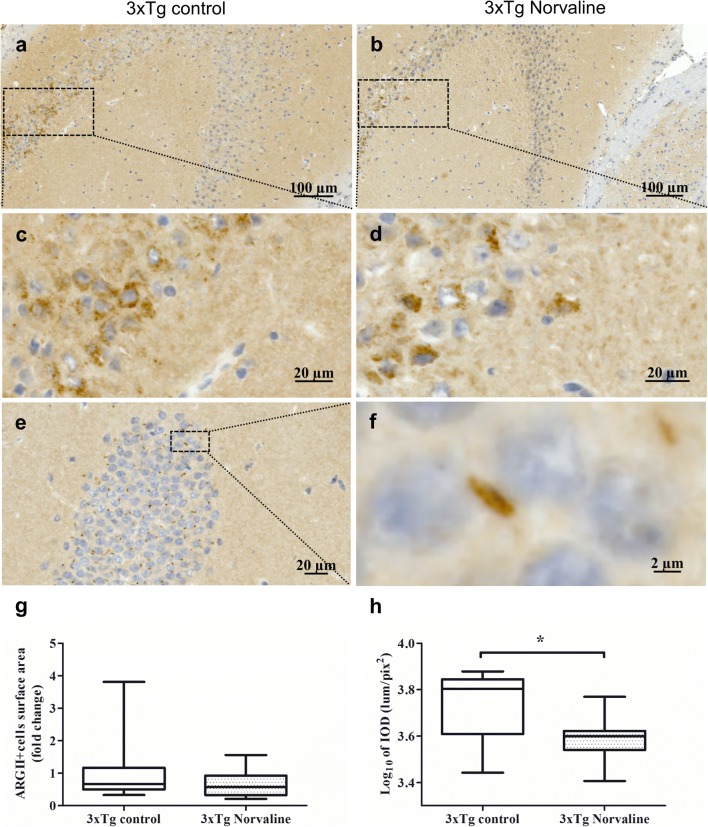
Fig. 10.
Representative hippocampal CA2–CA3 bright-field × 20 micrographs of the control (a) and L-norvaline-treated 3×Tg mice (b). CA2 × 40 insets of the control (c) and treated (d) mice. (e) A representative × 20 image of the dentate gyrus, with mitochondria stained with ARGII antibody (f) and a × 40 zoomed-in inset clearly showing a mitochondrion. (g) ARGII-positive cell surface area in the CA2 (S = 0.2 mm2). (h) The IOD of ARGII-positive cells in the CA2 area. Student’s t test, *p < 0.05, n = 12, with 4 mice per group

