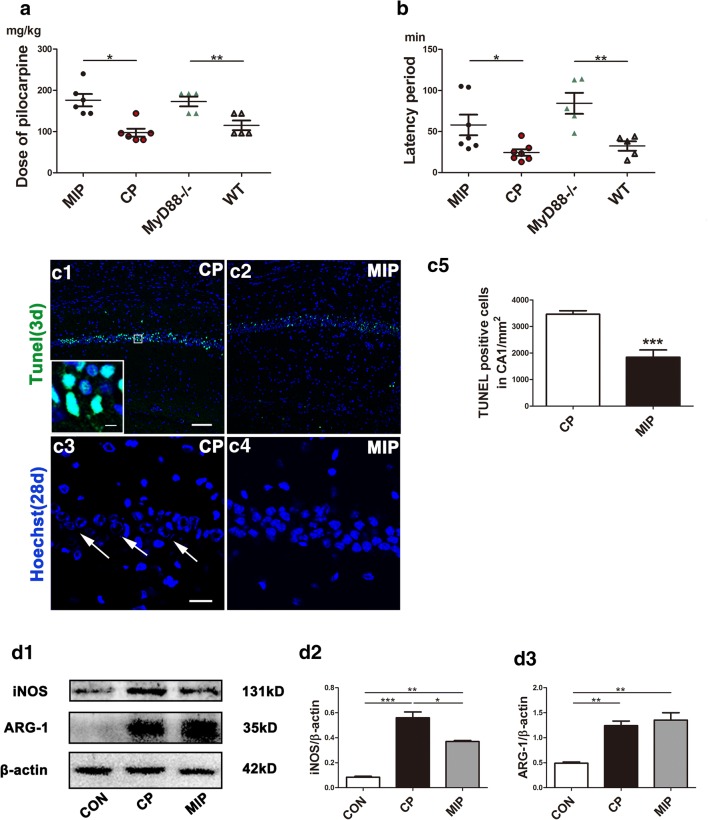
Fig. 5.
Effects of inhibition of MyD88 on SE occurrence, pyramidal neuron survival in mouse hippocampi, and expression of MG/MΦ polarization markers. (A) Comparison of the pilocarpine dose necessary to induce SE between the MIP and CP groups and between the MyD88−/− and WT groups. (B) Comparison of the latency period of SE between the MIP and CP groups and between the MyD88−/− and WT groups. Means ± SEM; n = 5; *p < 0.05 versus the CP group/WT group; **p < 0.01 versus the CP group/WT group. Independent samples t tests were performed. TUNEL staining showing CA1 in the CP (C1) and MIP (C2) groups 3 days after SE. The inset in (C1) shows a high-magnification view of TUNEL-positive CA1 pyramidal neurons. (C3) Remarkably reduced Hoechst staining in area CA1 of the hippocampus in the CP group 28 days after SE. (C4) Hoechst staining showed comparatively normal cell nuclei in the MIP group. Arrows in (C3) indicate cells in karyorrhexis in the CP group. (C5) Quantitative analysis of TUNEL-stained cells in the pyramidal layer of CA1 3 days after SE between the MIP and CP groups. Independent samples t test, ***p < 0.001. Scale bars: (C1, C2) 100 μm; (C3, C4) 50 μm; (C1) (inset) 12.5 μm. (D1) Immunoblots of iNOS and ARG-1 in the control and the CP and MIP groups’ hippocampi 3 days after SE. (D2–D3) Group comparison of iNOS and ARG-1 levels calibrated to β-actin. *p < 0.05, **p < 0.01, ***p < 0.001 between groups; 1-way ANOVA followed by Tukey’s test

