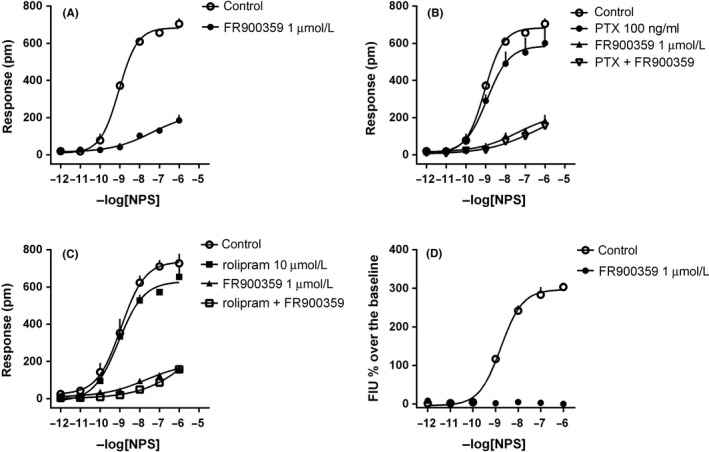
Figure 2.

DMR assay, concentration‐response curves to NPS in the absence and presence of FR900359 (A), PTX and FR900359 + PTX (B), rolipram and FR900359 + rolipram (C). Calcium mobilization assay, concentration‐response curves to NPS in the absence and presence of FR900359 (D). Data are the mean ± SEM of at least three experiments performed in duplicate
