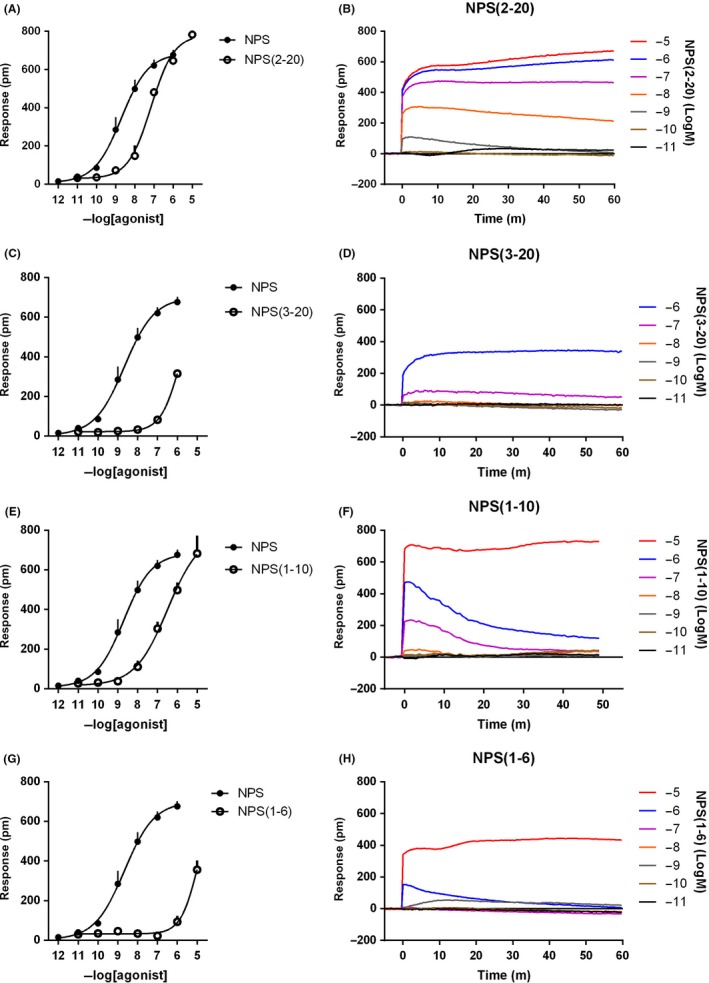
Figure 3.

Concentration‐response curves to NPS (2‐20), NPS (3‐20), NPS (1‐10), and NPS (1‐6). Sigmoidal curves are shown in the left panels, while representative raw DMR tracings are displayed in the right panels. Data are the mean ± SEM of at least three experiments performed in duplicate
