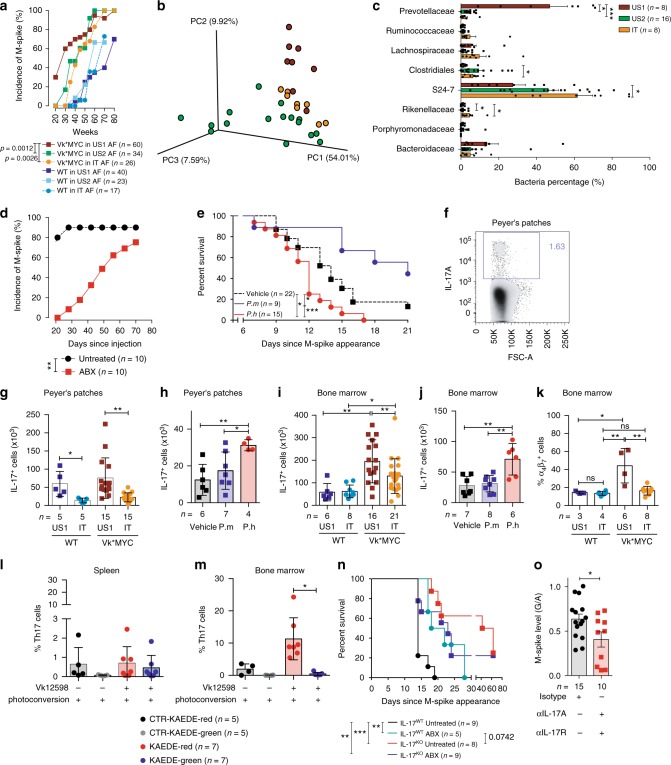
Fig. 1.
P. heparinolytica favors MM progression by promoting BM accrual of IL-17+ cells. a M-spike incidence over time (weeks) in sex-matched Vk*MYC and WT littermates housed in US1, US2 and IT animal facilities (AF) as indicated in the text. Statistical analyses (Two-way ANOVA). b Principal component analysis of fecal microbiota from mice housed in the indicated shelters. c Mean ± SD of eight taxa in fecal microbiota between US1 (n = 8 of biologically independent mice, US2 (n = 16) and IT (n = 8) mice relative to total number of reads recovered from each group. Statistical analyses (One-way ANOVA (Dunn’s multiple comparison test)): *P < 0.05, **P < 0.01, ***P < 0.001. d M-spike incidence over time (days) in t-Vk*MYC MM mice either maintained or not under antibiotics. Unpaired t test: Vehicle vs ABX up to 40 days: *P < 0.05. e Overall survival (Kaplan–Meier plot) of t-Vk*MYC MM mice gavaged with vehicle (Vehicle), P. heparinolytica (P.h) or P. melaninogenica (P.m). log-rank (Mantel–Cox) test: Vehicle vs P.h: P = 0.0157; Vehicle vs P.m: P = 0.0346, P.m vs P.h: P = 0.0002. f Representative dot plot of Peyer’s Patches IL-17+ cells (gated on live cells). g–j Number of Peyer’s Patches (g, h) and BM IL-17+ cells (i, j) from mice described in a (g, i) and e (h, j), respectively. k Quantification of α4β7+ cells gated on IL-17+ cells from the same samples shown in i. Mean ± SD of three independent experiments. Unpaired t test: *P < 0.05; **P < 0.01. l–m Frequency of KAEDE red positive (black and red columns) and negative (gray and green columns) Th17 cells in the spleen (l) and BM (m) of photoconverted control and diseased Kaede mice. Mean ± SD of three independent experiments. Wilcoxon matched-pairs signed rank test; *P = 0.0156. n Survival (Kaplan–Meier plot) of t-Vk*MYC MM mice IL-17 competent (IL-17WT) or deficient (IL-17KO) and maintained or not maintained under antibiotics. log-rank (Mantel–Cox) test: *P = 0.0332, **P = 0.0021. o M-spike levels are expressed as total gamma globulins/albumin ratio (G/A) in mice within the indicated cohort. Unpaired t-test: *P < 0.05. a–e, g–o n, number of mice used

