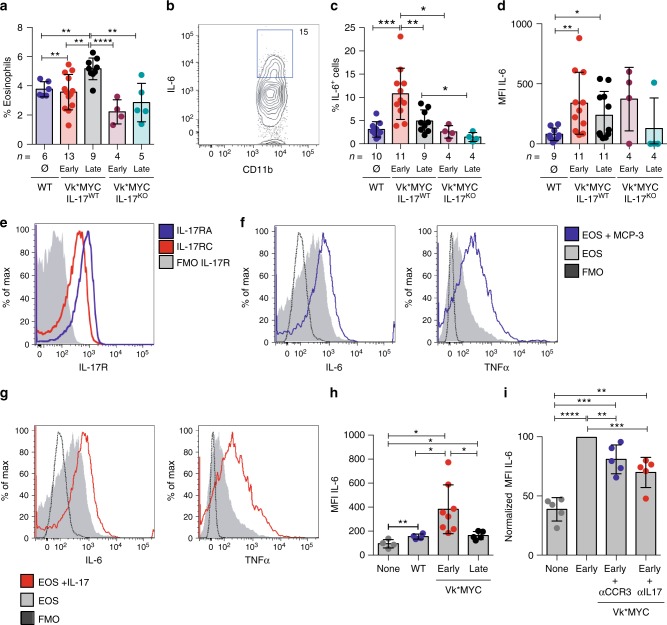
Fig. 5.
An IL-17-eosinophil axis in the BM of Vk*MYC mice favors disease progression. a Frequency of BM eosinophils (i.e., CD11b+Ly6CintMHC-II−Ly6G−SSChi or CD11b+Siglec-F+ cells) in Vk*MYC IL-17WT and Vk*MYC IL-17KO mice and age- and sex-matched WT littermates. Each dot represents an individual mouse. Mean ± SD of five independent experiments. Unpaired t test: *P < 0.05; **P < 0.01; ***P < 0.001; ****P < 0.0001. b Representative dot plot of IL-6+ cells (gated on CD11b+Siglec-F+ cells) in the BM. c Percentage of IL-6+ cells gated on CD11b+Siglec-F+ cells. Mean ± SD of five independent experiments. Unpaired t test. d Mean fluorescence intensity (MFI) of IL-6 within Siglec-F+CD11b+ cells. Mean ± SD of five independent experiments. Unpaired t test. e BM derived eosinophils were also stained with anti-IL-17RA and anti-IL-17RC antibodies (blue and red line respectively) and analyzed by flow-cytometry; FMO (Fluorescence Minus One) sample was not stained for IL-17R (gray histogram). f Representative histograms of IL-6 and TNF-α production by eosinophils after IL-17A stimulation (red line). FMO samples were not stained for IL-6 or TNF-α. g Representative histograms of IL-6 and TNF-α production by eosinophils after MCP-3 stimulation (blue line). FMO samples were not stained for IL-6 or TNF-α. h IL-6 levels (MFI normalized on FMO sample) in eosinophils cultured alone (None; n = 4), or in the presence of WT (n = 4) or Early-MM (n = 8) or Late-MM (n = 5) BM serum. Mean ± SD of aggregated data from three independent experiments. Unpaired t test. i IL-6 levels (MFI normalized on Early-MM sample) in eosinophils cultured alone (None; n = 5), or in the presence of Early-MM with or without the addition of anti-CCR3 (n = 5) or anti-IL-17A (n = 5). Mean ± SD of aggregated data from three independent experiments. Paired t test. a, c, d Specific n values of biologically independent mice are shown

