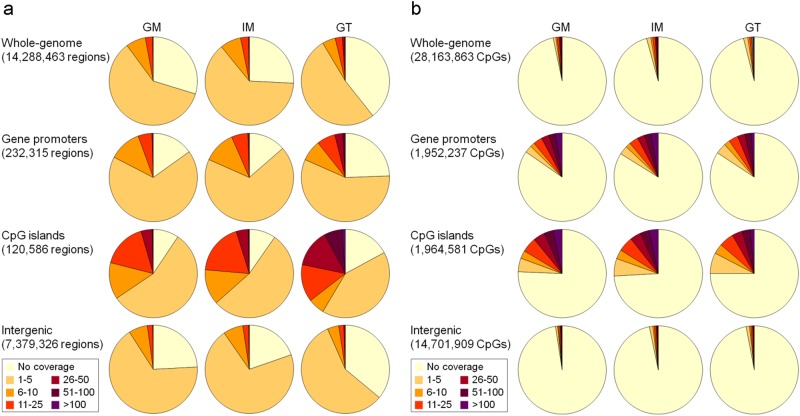
Fig. 2. Genome coverage of the methylation signatures from the MBD-seq and RRBS data of samples from a patient with GC.
(a) For the MBD-seq analysis, the methylation enrichment signatures were searched by 200 bp sliding on the whole-genome, gene promoters (2 kb regions centered on TSSs from RefSeq), CGIs, and intergenic (intergenic regions without promoters) regions. (b) For the RRBS analysis, the genomic coverage was assessed at the single base level in the same regions as those included in the MBD-seq analysis

