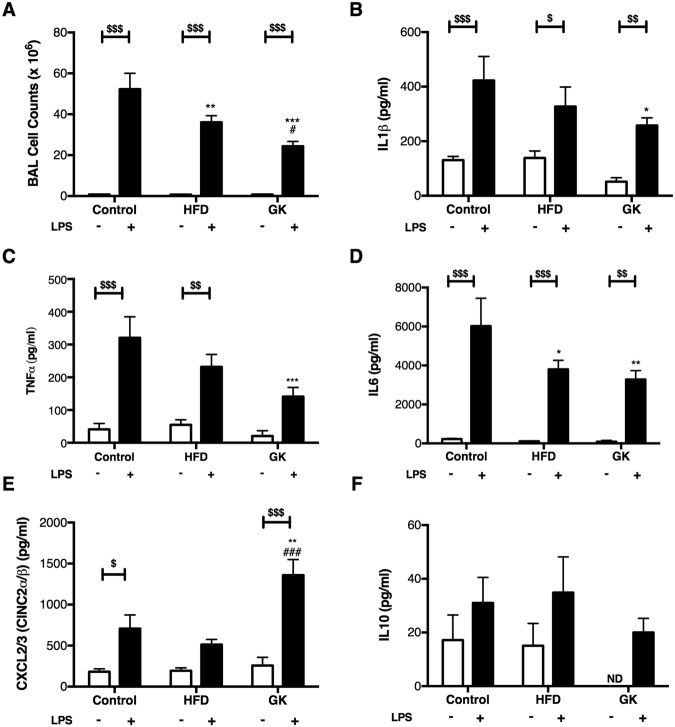
Figure 1.
Number of cells (A) and cytokine/chemokine (B–F) production in the BAL of the different groups. Cells were counted in a Neubauer chamber and cytokines were measured by ELISA. Control (n = 11); HFD (n = 9); GK (n = 10). Results are presented as mean ± S.E.M and n represents the number of animals used in each group. *p < 0.05 vs control; **p < 0.01 vs control; ***p < 0.001 vs control; #p < 0.05 vs HFD; ###p < 0.001 vs HFD; $p < 0.05 vs saline instillation of the same studied group; $$p < 0.01 vs saline instillation of the same studied group; $$$p < 0.001 vs saline instillation of the same studied group. ND (Not detected).

