Fig. 2.
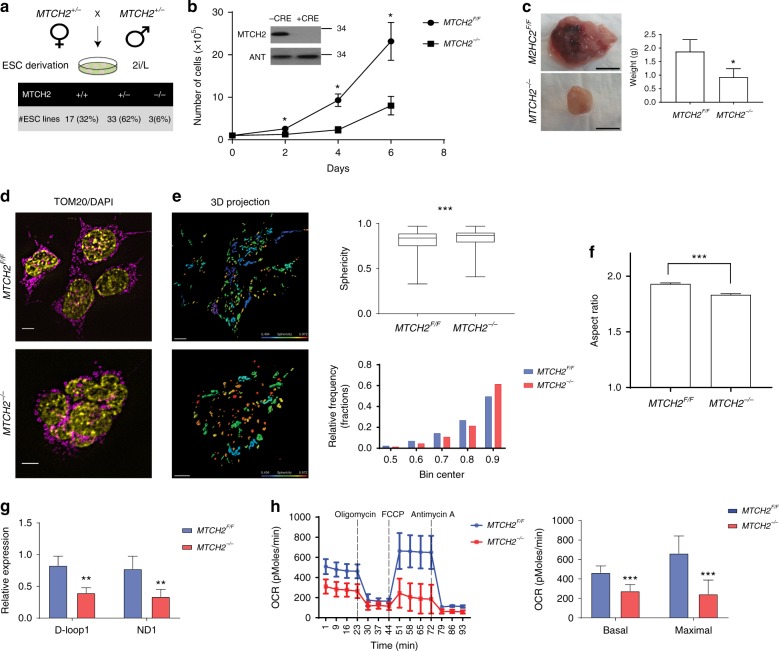
MTCH2 loss in ESCs results in mitochondrial fragmentation. a Blastocysts grown in 2i/L yielded MTCH2−/− ESCs at a ratio that is lower than the expected. Percentages of ESCs derivation efficiency after mating of MTCH2 heterozygous mice are presented. b Loss of MTCH2 in naïve ESCs results in slower cell growth. MTCH2F/F and MTCH2−/− ESCs growth curve. Results are presented as mean ± SD (*p < 0.05; n = 4). Inset: Immunoblot results of MTCH2 using anti-MTCH2 Abs of MTCH2F/F ESCs either left untreated (−CRE) or treated with Cre recombinant in vitro (+CRE). Mitochondrial adenine nucleotide translocator (ANT) serves as a loading control. c Teratomas obtained from the MTCH2−/− ESCs in vivo are smaller in size. Representative images are shown (scale bar, 1 cm). Results are presented as mean ± SEM (*p < 0.05; n = 4). Scale bar, 1 cm. d Loss of MTCH2 results in a less-elongated/round mitochondria morphology. Representative IF images (magenta, anti-TOM20 Abs; yellow, DAPI; Scale bar, 5 μM). e Loss of MTCH2 results in a hyper-spherical mitochondria morphology. Left panels: 3D mitochondria reconstruction of MTCH2F/F (upper panel) and MTCH2−/− (bottom panel) ESCs. Scale bar, 5 μM; Sphericity heat map, 0.404–0.972. Top right panel: Box and whiskers plot showing sphericity analysis of 3D reconstructed mitochondria. Results are presented as minimum, lower quartile, median, upper quartile, and maximum values (***p < 0.001; n > 60 cells were scored in three independent experiments)). Bottom right panel: Histogram representation of frequency distribution of the sphericity values of mitochondria. f Loss of MTCH2 resulted in a hyper-fragmented mitochondria morphology. Aspect ratio calculations of MTCH2F/F and MTCH2−/− mitochondria are presented. Results are presented as mean ± SEM (***p < 0.001; n > 60 cells were scored in three independent experiments). g Loss of MTCH2 in ESCs results in a decrease in mtDNA copy number. qPCR results of MTCH2F/F and MTCH2−/− ESCs mtDNA copy number are presented. Results are presented as mean ± SD (**p < 0.01; n = 3). h Loss of MTCH2 in ESCs results in a decrease in mitochondrial respiration. MTCH2F/F and MTCH2−/− ESCs were analyzed with the XF24 seahorse analyzer (left panel). Basal and maximal OCR/respiration are presented (right panel). Results are presented as mean ± SD (***p < 0.001; n = 3)

