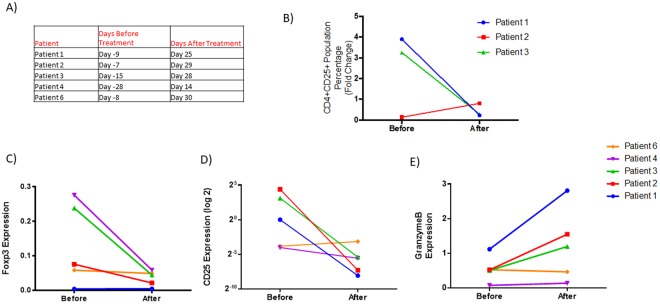
Figure 5.
Midostaurin alters CD4 + CD25 + T cell population and T cell gene expression markers in patients with AML. (A) Table indicating time points before and after midostaurin treatment for patient samples. (B) Levels of CD4 + CD25+ population before and after midostaurin treatment. (C) FOXP3 and (D) CD25 mRNA normalized to CD3 and CD4 expression before and after midostaurin treatment. (E) Expression change of GZMB mRNA normalized to CD3 and CD8 mRNA expression before and after midostaurin treatment.

