Fig. 2.
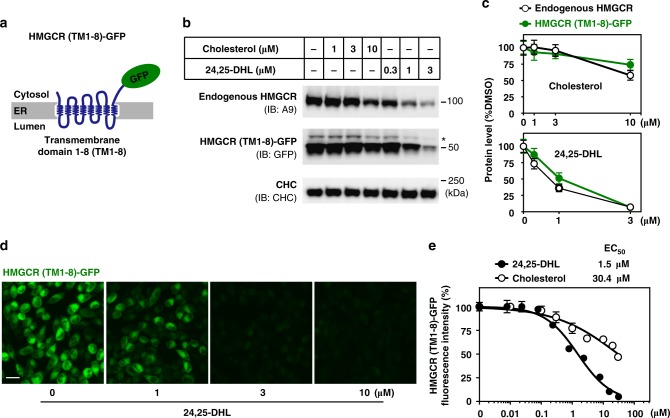
A reporting system that measures HMGCR degradation. a Schematic of the HMGCR (TM1-8)-GFP fusion protein. TM, transmembrane. b, c CHO-7 cells stably expressing HMGCR (TM1-8)-GFP (CHG) were incubated with cholesterol or 24,25-DHL at indicated concentrations for 16 h and harvested for immunoblotting. b Endogenous HMGCR (IgG-A9) and overexpressed HMGCR (TM1-8)-GFP (polyclonal rabbit anti-GFP) protein were analyzed by immunoblotting. Asterisk represents a non-specific band. c Quantification of endogenous and overexpressed HMGCR protein levels in response to cholesterol or 24,25-DHL shown in b. The mean intensity of HMGCR protein bands in DMSO-treated cells was defined as 100. d, e CHG cells were incubated with varying concentrations of 24,25-DHL for 16 h. Cells were then fixed for immunofluorescence analysis. d Representative images showing a dose-dependent decrease of GFP signals following 24,25-DHL treatment. Scale bar, 20 μm. e Dose–response curves of HMGCR (TM1-8)-GFP fluorescent intensity to varying concentrations of cholesterol or 24,25-DHL. The GFP intensity of DMSO-treated cells was defined as 100. The mean EC50 values of cholesterol and 24,25-DH were 30.4 μM and 1.5 μM, respectively. Data are from three independent experiments and presented as mean ± SD. Source data are provided as a Source Data File. Uncropped immunoblots are shown in Supplementary Fig. 9

