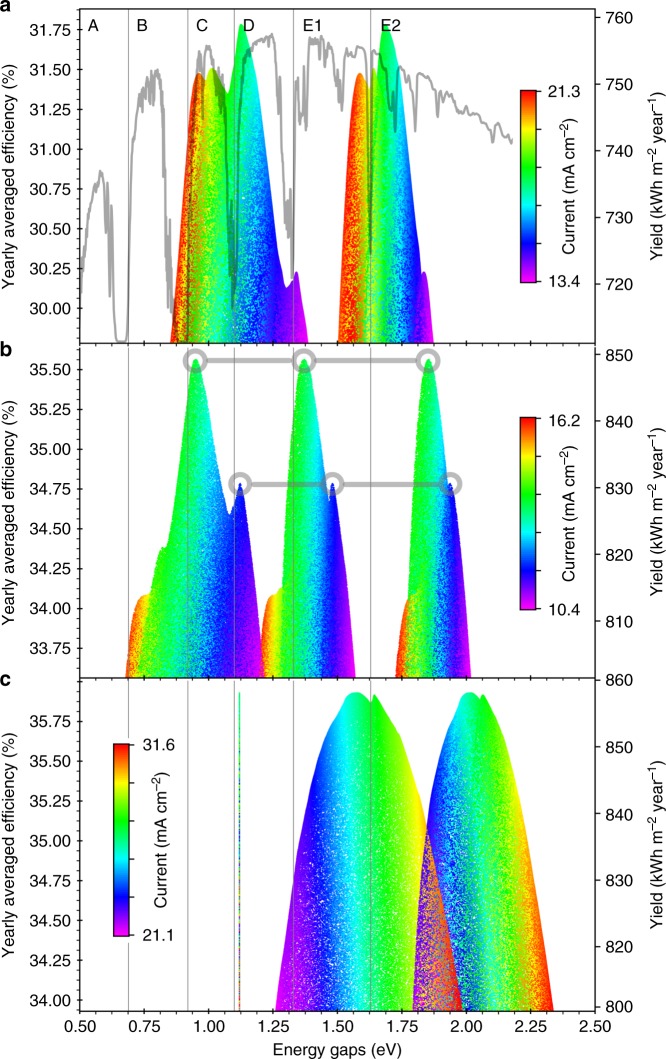
Fig. 4.
Energy yields at 1 sun. Labels on top correspond to the low energy thresholds of each of the atmospheric transmission bands. a Two junctions. The standard global spectral irradiance is overlaid to highlight the alignment of the optimal band gaps with the transmission bands in the spectrum. b Three junctions. Two sets of near optimal band gaps are highlighted to illustrate that points with the same efficiency value and the same color (average photocurrent) are junctions belonging in the same tandem device. c Three junctions with a mechanically stacked and electrically isolated monofacial silicon bottom junction

