Figure 3.
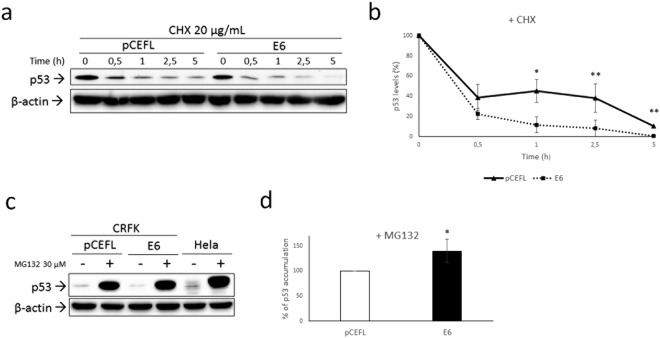
Analysis of p53 half-life and proteasomal degradation. (a) CRFKpCEFL and CRFKE6 were treated with protein synthesis inhibitor cycloheximide (20 µg/mL) and collected at different time points indicated in hours (h). Cells were lysed and analysed by WB for p53, then the blot was stripped and reprobed for β-actin to ensure equal protein loading in each lane and allow normalization. A representative gel demonstrating p53 shorter half-life in presence of FcaPV-2 E6 is shown. (b) The graph shows the quantification of p53 bands, normalized to β-actin levels and calibrated against the levels of p53 at time 0 of treatment (set as 100%). Results shown are the means +/− standard deviation (SD) of at least three independent experiments and demonstrate accelerated p53 degradation in CRFKE6 compared to CRFKpCEFL at each time point (Time 1: P = 0.057; Time 2.5: P = 0.0345; Time 5: P = 0,0034). (c) CRFKpCEFL and CRFKE6 were treated with the proteasome inhibitor MG132 at 30 µM for 4 h and collected to be analysed by WB for p53. Hela were concomitantly analysed as control. The blot was stripped and reprobed for β-actin to ensure equal protein loading in each lane and allow normalization. (d) Accumulation upon MG132 treatment in CRFKpCEFL with respect to untreated cells was calculated by densitometric quantification of p53 bands normalized to β-actin levels and arbitrarily set as 100% (white bar). The same calculation was applied to treated vs untreated CRFKE6 and the difference in the % of accumulation obtained by ratio with the value pointed out in CRFKpCEFL (black bar). Results shown are the means +/− SD of four independent experiments and demonstrate higher % of p53 accumulation in CRFKE6 compared to CRFKpCEFL (P = 0.0152).

