Figure 5.
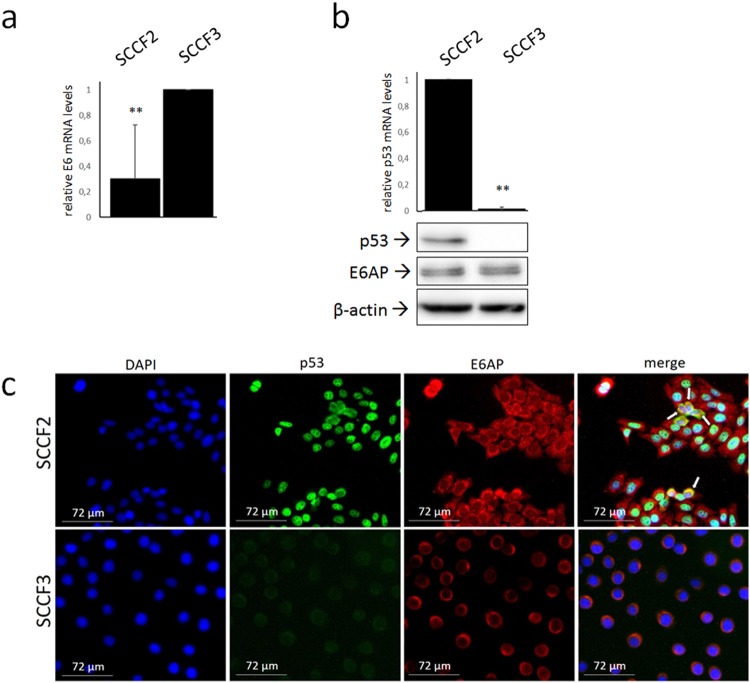
FcaPV-2 E6 mRNA levels, expression and localization of p53 and E6AP in feline oral SCC cell lines. (a) SCCF2 and SCCF3 cells were subjected to RNA extraction, reverse transcription and Real time quantitative PCR (qPCR) to analyse FcaPV-2 E6 gene expression. Results were normalised for β2-microglobulin expression. The graph shows the results as mean +/− standard deviations (SD) of five independent experiments where the cell line with higher E6 expression levels (SCCF3) (P = 0.0062) was arbitrarily set as calibrator. (b) Cells were analysed by Real-time qPCR for p53 gene expression and results normalized as above. The graph represents mean +/− SD from three independent experiment and demonstrates p53 down-regulation in SCCF3 compared to SCCF2 set as calibrator (P = 0.00). Representative WB gels for p53 and E6AP are also shown. Stripping and reprobing with β-actin confirmed equal protein loadings. (c) SCCF2 and SCCF3 cells were grown on coverslips and subjected to double IF staining for p53 (green fluorescence) and E6AP (red fluorescence), nuclei were counterstained with DAPI. Representative fields showing nuclear or cytoplasmic/perinuclear p53 expression in SCCF2 and undetectable p53 staining in SCCF3 are illustrated. White arrows indicate perinuclear co-localization (yellow fluorescence) of the two proteins in a sub-set of SCCF2 cells in the merge panel.

