Figure 2.
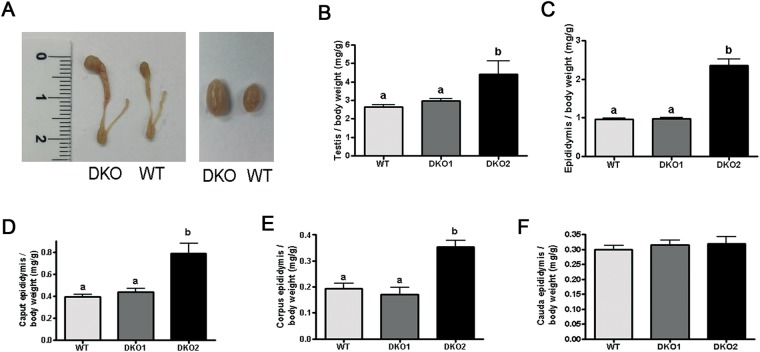
Testicular and epididymal phenotype in DKO mice: (A) representative pictures of DKO and WT epididymides (left) and testes (right). Testicular (B) and epididymal (C) weight relative to total body weight from WT, Group 1 (DKO1) and Group 2 (DKO2) mice. Data are mean ± SEM, n = 21. Caput (D), corpus (E) and cauda (F) weight relative to total body weight from WT, DKO1 and DKO2. Data are mean ± SEM, n = 9. In all cases, different letters indicate significant between groups (a vs b, p < 0.01).

