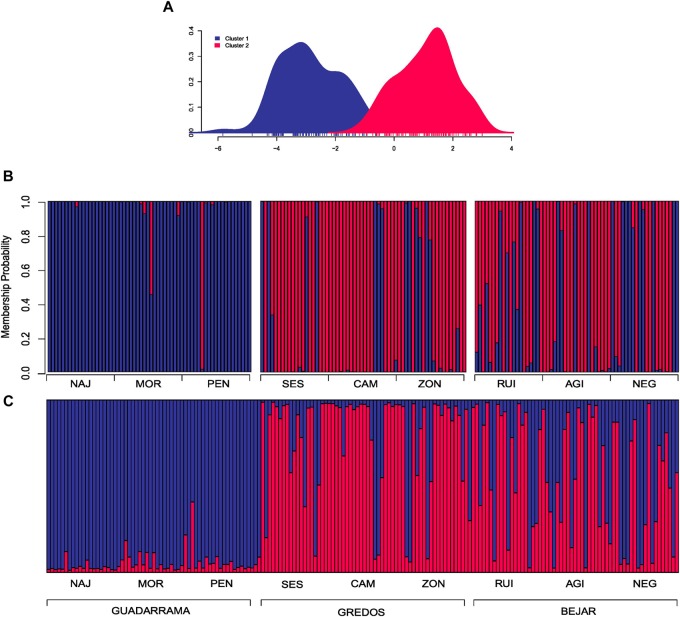
FIGURE 2.
Discriminate analysis of principal components (DAPC) and Bayesian analysis of population structure (STRUCTURE) for two clusters conformation (K = 2). (A) Scatterplot of the first two principal components showing the differentiation between the two groups by colors. (B) DAPC composition plot (compoplot) of each individual grouped by mountain ranges. Colors represent the same clusters as the scatterplot. (C) STRUCTURE composition plot (compoplot) of each individual grouped by mountain ranges.

