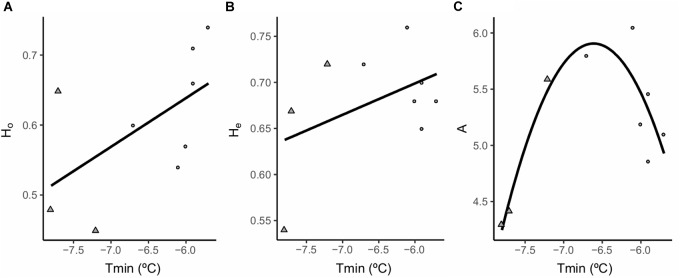
FIGURE 4.
Significant relationships between the different genetic diversity estimators and the environmental variables used in the models. (A) Ho, observed heterozygosity; (B) He, expected heterozygosity; (C) A, mean allelic richness per locus (average number of alleles per locus). Tmin; minimum annual temperature. Dots represent populations classified as “marginal” and triangles populations classified as “optimal.”

