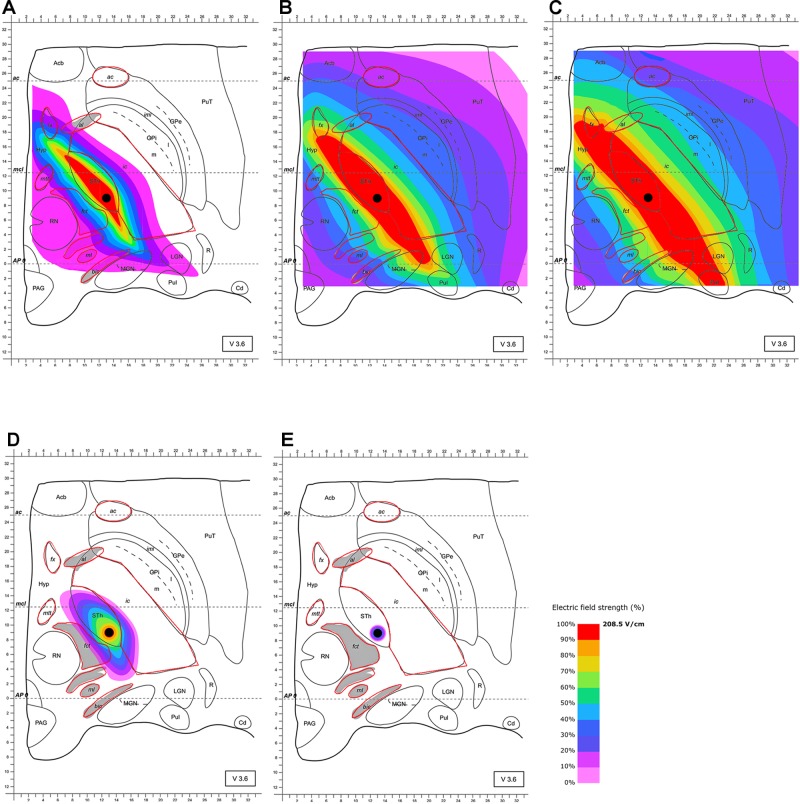
FIGURE 2.
Simulation of the electric field generated by omnidirectional monopolar stimulation (130 Hz, 60 μs and 2 mA) with the electrode lead positioned in the STN (black circle within “Sth”). Electric field distribution after (A) 10 μs; (B) 40 μs; (C) 63 μs (maximal field extension); (D) 67 μs and (E) 68 μs; for abbreviations see Figure 1.

