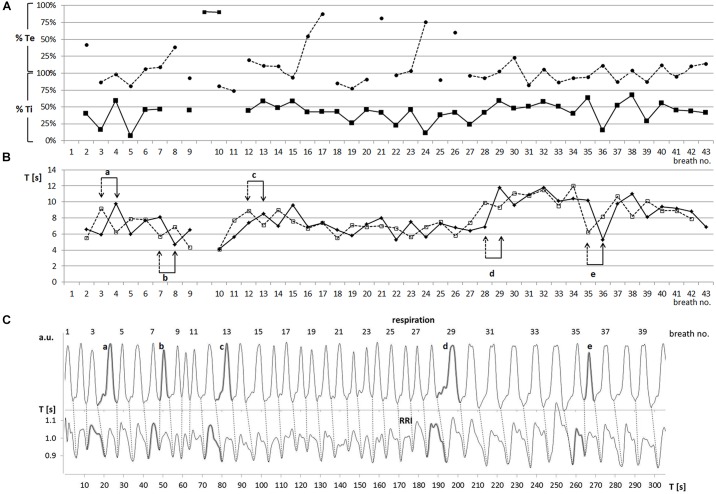
FIGURE 2.
(A) Sequential plot of relative phases RPmin (–■–) and RPmax (---●---) [% of Ti and Te] (one characteristic participant: subject 11). Abscissa: breath number; ordinate: RP in % Te (upper part) and % Ti (lower part). (B) Sequential plot of duration of breathing (Ttot, –◆–) and RRI (Trri-tot, ---◻---) waves (subject 11). Abscissa, breath number; ordinate, Ttot, Trri-tot [s]. Pairs of arrows (a–e) mark changes in period duration. Note that these changes occur first in the RRI rhythm (dashed arrow) and are followed in the breathing rhythm (solid arrow) one period later. (C) Breathing (upper trace) and RRI waves (lower trace; subject 11). Breath number is given above the upper curve. Abscissa, time [s]; ordinate, arbitrary units (upper part), RR interval [s] (lower part). Shaded waves in both curves (a–e) correspond to the paired events a–e in part B.

