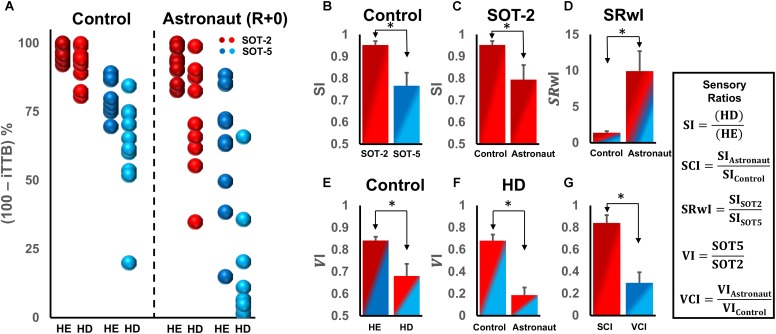
FIGURE 4.
(A) Comparison of postural control performance as (100 – iTTB) % in controls and astronauts on the return day (R+0) for the two head and the two support surface tilt conditions. (B) Somatosensory index (SI) for the two support surface conditions for control subjects. (C) SI for control and astronaut subjects in SOT-2 condition on R+0. (D) Somatosensory reweighing (SRwI) index for control and astronaut subjects. (E) Vestibular index (VI) for the two types of head conditions for control subjects. (F) VI for control and astronaut subjects in the HD condition. (G) The somatosensory change index (SCI) for SOT-2 and the vestibular change index (VCI) for HD. The color shading in bars (B–G) is based on colors used to represent raw data in (A). ∗p < 0.05.

