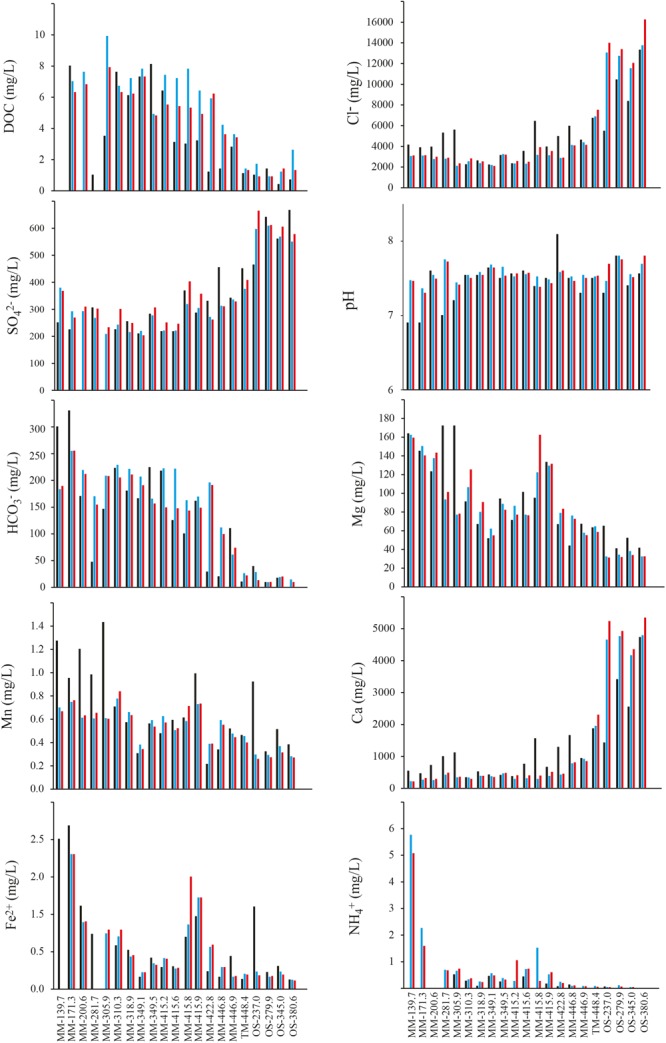
FIGURE 2.

(Geo)chemical data for the 21 borehole sections. The black bar shows the first sampling occasion in the section (typically early/mid 1990s), the blue bar gives the value measured in approximately May 2013, and the red bar was measured in May 2016.
