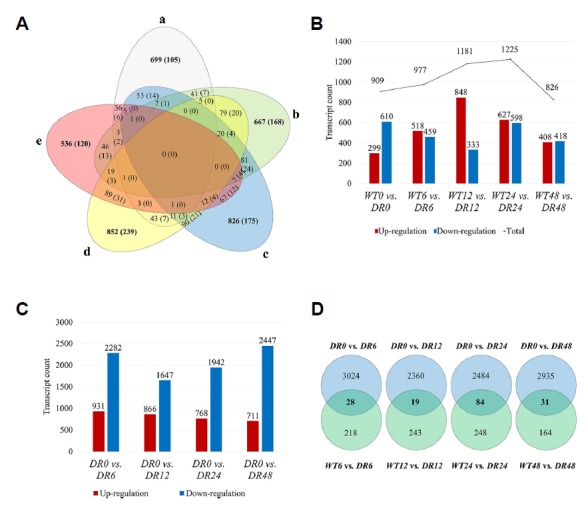
Fig. 2. Comparison of the assembled transcripts.

(A) Venn diagram of DEGs mapping results. Areas of overlap show the number of DEGs successfully mapped to all overlapping databases. Results are shown only for WT0 vs. DR0 (a), WT6 vs. DR6 (b), WT12 vs. DR12 (c), WT24 vs. DR24 (d), and WT48 vs. DR48 (e) DEGs. The numbers in parentheses are annotated DEG against phytozome database. Numbers of sequence matches at absolute log2 fold change ≥ 2, probability ≥ 0.95 are shown. (B) Pairwise comparison of up-regulated and down-regulated DEGs in WT and DR plants in the time-course under PEG treatment. (C) Number of up-regulated and down-regulated DEGs following PEG treatment in DR plant. (D) Venn diagram of number of DEGs with combined analysis of results from WT vs. Mutant and DR(drought)_control vs DR.
