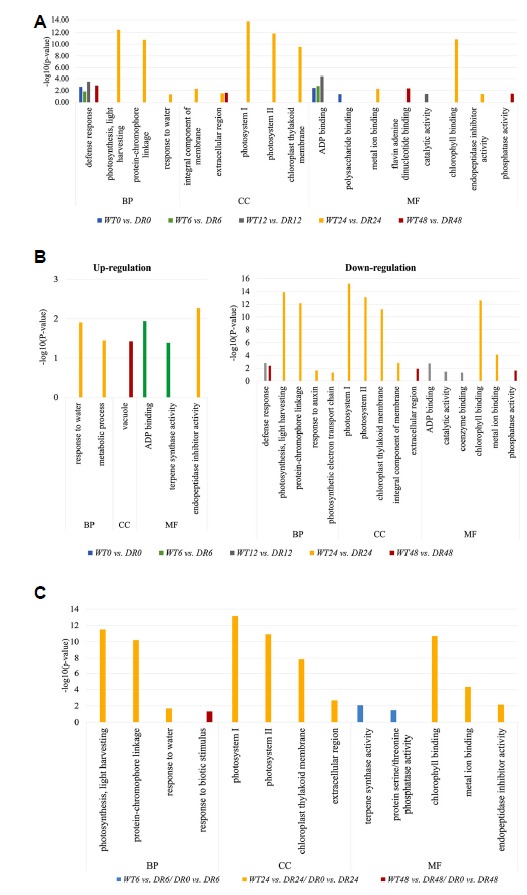
Fig. 3. Gene Ontology classification of differentially expressed genes.

These figures show the distribution of GO terms exhibiting significant differences (p-value ≤ 0.05 and absolute log2 fold change ≥ 2). GO analysis of the total DEGs (A), up-regulated and down-regulated DEGs (B) by time-course of WT and DR plants in drought stress in three main classes (‘Biological Process’, ‘Cellular Component’, and ‘Molecular Function’). (C) The significant biological process, cell compartment and molecular function GO terms are shown in each combined analysis “DR_control (DR0) vs. DR and WT vs. DR.
